Electronic Arts 2000 Annual Report Download - page 57
Download and view the complete annual report
Please find page 57 of the 2000 Electronic Arts annual report below. You can navigate through the pages in the report by either clicking on the pages listed below, or by using the keyword search tool below to find specific information within the annual report.-
 1
1 -
2
-
3
-
4
-
5
-
6
-
7
-
8
-
9
-
10
-
11
-
12
-
13
-
14
-
15
-
16
-
17
-
18
-
19
-
20
-
21
-
22
-
23
-
24
-
25
-
26
-
27
-
28
-
29
-
30
-
31
-
32
-
33
-
34
-
35
-
36
-
37
-
38
-
39
-
40
-
41
-
42
-
43
-
44
-
45
-
46
-
 47
47 -
 48
48 -
 49
49 -
 50
50 -
 51
51 -
 52
52 -
 53
53 -
 54
54 -
 55
55 -
 56
56 -
 57
57 -
 58
58 -
 59
59 -
 60
60 -
 61
61 -
 62
62 -
 63
63 -
 64
64 -
 65
65 -
 66
66 -
 67
67 -
68
-
69
-
70
-
71
-
72
 |
 |

The Company is also committed to spend $5 million in advertising with News Corp. or any of its affiliates.
If a qualified public offering of Class B common stock does not occur within twenty-four months of News Corp’s purchase of
such shares, then News Corp has the right to (1) exchange Class B common stock for approximately 103,000 shares of Class A
common stock, and (2) receive cash from Electronic Arts in the amount of $9,650,000.
The acquisition has been accounted for under the purchase method. The results of operations of Kesmai and the estimated
fair market values of the acquired assets and liabilities have been included in the consolidated financial statements from the
date of acquisition. The adjusted allocation of the excess purchase price over the net tangible liabilities assumed was
$32,815,000, of which, based on management’s estimates prepared in conjunction with a third party valuation consultant,
$3,869,000 was allocated to purchased in-process research and development and $28,946,000 was allocated to other intangi-
ble assets. Amounts allocated to other intangibles include goodwill of $18,932,000, existing technology of $3,992,000,
amounts attributed to a prior AOL agreement of $3,131,000 and other intangibles of $2,891,000. The allocation of intangible
assets is being amortized over lives ranging from two to seven years.
Purchased in-process research and development includes the value of products in the development stage that are not
considered to have reached technological feasibility or to have alternative future use. Accordingly, this non-recurring item was
expensed in the Consolidated Statement of Income upon consummation of the acquisition. The non-recurring charge for in-
process research and development reduced diluted earnings per share by approximately $0.04 in the fiscal year 2000.
In connection with the acquisition of Kesmai, the Company allocated and expensed $3,869,000 of the purchase price to
acquired in-process technology. Kesmai had various projects in progress at the time of the acquisition. As of the acquisition
date, costs to complete Kesmai projects acquired were expected to be approximately $10,550,000 in future periods. The
Company believes there have been no significant changes to these estimates as of March 31, 2000. The Company currently
expects to complete the development of these projects at various dates through fiscal 2002 and to publish the projects upon
completion. In conjunction with the merger of Kesmai, the Company accrued approximately $200,000 related to direct transac-
tion costs and other related costs. At March 31, 2000 there were $133,000 in accruals remaining related to these items.
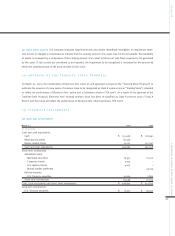
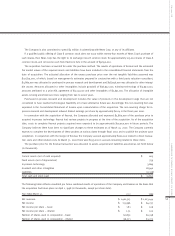
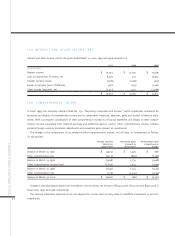
The purchase price for the Kesmai transaction was allocated to assets acquired and liabilities assumed as set forth below
(in thousands):
Current assets (net of cash acquired) $605
Fixed assets (net of depreciation) 759
In-process technology 3,869
Goodwill and other intangibles 28,946
Liabilities (2,326)
Total cash and stock paid $31,853
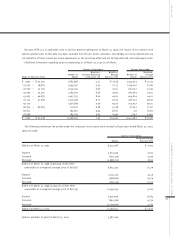
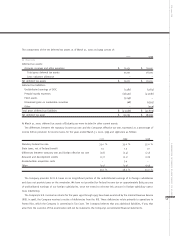
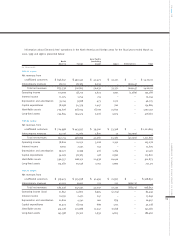
The following table reflects unaudited pro forma combined results of operations of the Company and Kesmai on the basis that
the acquisition had taken place on April 1, 1998 (in thousands, except per share data):
Year Ended March 31, 2000 1999
Net revenues $1,421,313 $ 1,223,444
Net income $113,996 $ 64,237
Net income per share – basic $ 1.81 $ 1.06
Net income per share – diluted $ 1.72 $ 1.02
Number of shares used in computation - basic 62,830 60,748
Number of shares used in computation - diluted 66,371 63,272
EA 2000 AR
55
NOTES TO CONSOLIDATED FINANCIAL STATEMENTS