Electronic Arts 2000 Annual Report Download - page 19
Download and view the complete annual report
Please find page 19 of the 2000 Electronic Arts annual report below. You can navigate through the pages in the report by either clicking on the pages listed below, or by using the keyword search tool below to find specific information within the annual report.-
 1
1 -
2
-
3
-
4
-
5
-
6
-
7
-
8
-
 9
9 -
 10
10 -
 11
11 -
 12
12 -
 13
13 -
 14
14 -
 15
15 -
 16
16 -
 17
17 -
 18
18 -
 19
19 -
 20
20 -
 21
21 -
 22
22 -
 23
23 -
 24
24 -
 25
25 -
 26
26 -
 27
27 -
 28
28 -
 29
29 -
30
-
31
-
32
-
33
-
34
-
35
-
36
-
37
-
38
-
39
-
40
-
41
-
42
-
43
-
44
-
45
-
46
-
47
-
48
-
49
-
50
-
51
-
52
-
53
-
54
-
55
-
56
-
57
-
58
-
59
-
60
-
61
-
62
-
63
-
64
-
65
-
66
-
67
-
68
-
69
-
70
-
71
-
72
 |
 |

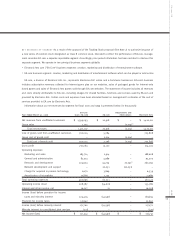
NET REVENUES BY SEGMENT As a result of the approval of the Tracking Stock proposal (See Note 2) to authorize issuance of
a new series of common stock designated as Class B common stock, intended to reflect the performance of EA.com, manage-
ment considers EA.com a separate reportable segment. Accordingly, prior period information has been restated to disclose this
separate segment. We operate in two principal business segments globally:
•Electronic Arts core (“EA Core”) business segment: creation, marketing and distribution of entertainment software.
•EA.com business segment: creation, marketing and distribution of entertainment software which can be played or sold online.
EA.com, a division of Electronic Arts Inc., represents Electronic Arts’ online and e-Commerce businesses. EA.com’s business
includes subscription revenues collected for Internet game play on our websites, sales of packaged goods for Internet-only
based games and sales of Electronic Arts games sold through EA.com websites. The statement of income includes all revenues
and costs directly attributable to EA.com, including charges for shared facilities, functions and services used by EA.com and
provided by Electronic Arts. Certain costs and expenses have been allocated based on management’s estimates of the cost of
services provided to EA.com by Electronic Arts.
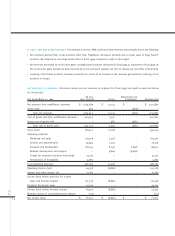
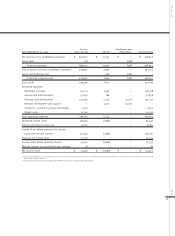
Information about our net revenues by segment for fiscal 2000 and 1999 is presented below (in thousands):
EA Core Adjustments and
Year Ended March 31, 2000 (excl. EA.com) EA.com Eliminations Electronic Arts
Net revenues from unaffiliated customers $ 1,399,093 $ 20,918 $ – $ 1,420,011
Group sales 2,014 – (2,014)(a) –
Total net revenues 1,401,107 20,918 (2,014) 1,420,011
Cost of goods sold from unaffiliated customers 700,024 5,784 – 705,808
Group cost of goods sold – 2,014 (2,014) –
Total cost of goods sold 700,024 7,798 (2,014) 705,808
Gross profit 701,083 13,120 – 714,203
Operating expenses:
Marketing and sales 185,714 2,914 – 188,628
General and administrative 87,513 4,989 – 92,502
Research and development 205,933 34,775 20,051(b) 260,759
Network development and support – 20,051 (20,051) –
Charge for acquired in-process technology 2,670 3,869 – 6,539
Amortization of intangibles 10,866 1,123 – 11,989
Total operating expenses 492,696 67,721 – 560,417
Operating income (loss) 208,387 (54,601) – 153,786
Interest and other income, net 16,017 11 – 16,028
Income (loss) before provision for income
taxes and minority interest 224,404 (54,590) – 169,814
Provision for income taxes 52,642 – – 52,642
Income (loss) before minority interest 171,762 (54,590) – 117,172
Minority interest in consolidated joint venture (421) – – (421)
Net income (loss) $ 171,341 $ (54,590) $ – $ 116,751
EA 2000 AR
17
MD&A