Electronic Arts 2000 Annual Report Download - page 43
Download and view the complete annual report
Please find page 43 of the 2000 Electronic Arts annual report below. You can navigate through the pages in the report by either clicking on the pages listed below, or by using the keyword search tool below to find specific information within the annual report.-
 1
1 -
2
-
3
-
4
-
5
-
6
-
7
-
8
-
9
-
10
-
11
-
12
-
13
-
14
-
15
-
16
-
17
-
18
-
19
-
20
-
21
-
22
-
23
-
24
-
25
-
26
-
27
-
28
-
29
-
30
-
31
-
32
-
 33
33 -
 34
34 -
 35
35 -
 36
36 -
 37
37 -
 38
38 -
 39
39 -
 40
40 -
 41
41 -
 42
42 -
 43
43 -
 44
44 -
 45
45 -
 46
46 -
 47
47 -
 48
48 -
 49
49 -
 50
50 -
 51
51 -
 52
52 -
 53
53 -
54
-
55
-
56
-
57
-
58
-
59
-
60
-
61
-
62
-
63
-
64
-
65
-
66
-
67
-
68
-
69
-
70
-
71
-
72
 |
 |

EA 2000 AR
41
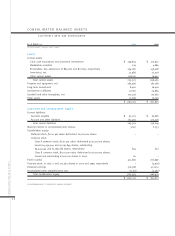
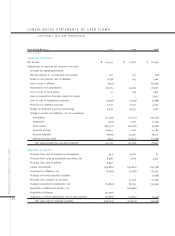
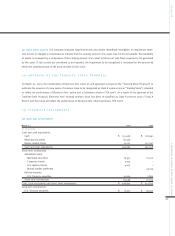
CONSOLIDATED STATEMENTS OF CASH FLOWS
Years Ended March 31, 2000 1999 1998
(In thousands)
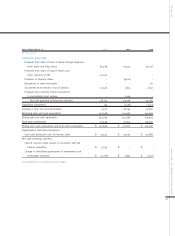
FINANCING ACTIVITIES:
Proceeds from sales of Class A shares through employee
stock plans and other plans 85,589 30,577 37,748
Proceeds from sales of Class B shares and
stock warrants to AOL 20,000 – –
Purchase of treasury shares – (9,001) –
Repayment of notes receivable – – 87
Tax benefit from exercise of stock options 32,563 5,614 7,931
Proceeds from minority interest investment
in consolidated joint venture – 2,109 –
Net cash provided by financing activities 138,152 29,299 45,766
Translation adjustment 124 (2,191) (1,273)
Increase in cash and cash equivalents 4,057 26,245 73,967
Beginning cash and cash equivalents 242,208 215,963 141,996
Ending cash and cash equivalents 246,265 242,208 215,963
Short-term investments 93,539 70,614 158,597
Ending cash, cash equivalents and short-term investments $ 339,804 $ 312,822 $ 374,560
Supplemental cash flow information:
Cash paid during the year for income taxes $ 15,525 $ 43,050 $ 32,888
Non-cash investing activities:
Class B common stock issued in connection with the
Kesmai acquisition $ 9,353 $ – $ –
Change in unrealized appreciation of investments and
marketable securities $ (5,008) $ 1,805 $ (1,411)
SEE ACCOMPANYING NOTES TO CONSOLIDATED FINANCIAL STATEMENTS.