HSBC 2010 Annual Report Download - page 14
Download and view the complete annual report
Please find page 14 of the 2010 HSBC annual report below. You can navigate through the pages in the report by either clicking on the pages listed below, or by using the keyword search tool below to find specific information within the annual report.-
 1
1 -
2
-
3
-
 4
4 -
 5
5 -
 6
6 -
 7
7 -
 8
8 -
 9
9 -
 10
10 -
 11
11 -
 12
12 -
 13
13 -
 14
14 -
 15
15 -
 16
16 -
 17
17 -
 18
18 -
 19
19 -
 20
20 -
 21
21 -
 22
22 -
 23
23 -
 24
24 -
25
-
26
-
27
-
28
-
29
-
30
-
31
-
32
-
33
-
34
-
35
-
36
-
37
-
38
-
39
-
40
-
41
-
42
-
43
-
44
-
45
-
46
-
47
-
48
-
49
-
50
-
51
-
52
-
53
-
54
-
55
-
56
-
57
-
58
-
59
-
60
-
61
-
62
-
63
-
64
-
65
-
66
-
67
-
68
-
69
-
70
-
71
-
72
-
73
-
74
-
75
-
76
-
77
-
78
-
79
-
80
-
81
-
82
-
83
-
84
-
85
-
86
-
87
-
88
-
89
-
90
-
91
-
92
-
93
-
94
-
95
-
96
-
97
-
98
-
99
-
100
-
101
-
102
-
103
-
104
-
105
-
106
-
107
-
108
-
109
-
110
-
111
-
112
-
113
-
114
-
115
-
116
-
117
-
118
-
119
-
120
-
121
-
122
-
123
-
124
-
125
-
126
-
127
-
128
-
129
-
130
-
131
-
132
-
133
-
134
-
135
-
136
-
137
-
138
-
139
-
140
-
141
-
142
-
143
-
144
-
145
-
146
-
147
-
148
-
149
-
150
-
151
-
152
-
153
-
154
-
155
-
156
-
157
-
158
-
159
-
160
-
161
-
162
-
163
-
164
-
165
-
166
-
167
-
168
-
169
-
170
-
171
-
172
-
173
-
174
-
175
-
176
-
177
-
178
-
179
-
180
-
181
-
182
-
183
-
184
-
185
-
186
-
187
-
188
-
189
-
190
-
191
-
192
-
193
-
194
-
195
-
196
-
197
-
198
-
199
-
200
-
201
-
202
-
203
-
204
-
205
-
206
-
207
-
208
-
209
-
210
-
211
-
212
-
213
-
214
-
215
-
216
-
217
-
218
-
219
-
220
-
221
-
222
-
223
-
224
-
225
-
226
-
227
-
228
-
229
-
230
-
231
-
232
-
233
-
234
-
235
-
236
-
237
-
238
-
239
-
240
-
241
-
242
-
243
-
244
-
245
-
246
-
247
-
248
-
249
-
250
-
251
-
252
-
253
-
254
-
255
-
256
-
257
-
258
-
259
-
260
-
261
-
262
-
263
-
264
-
265
-
266
-
267
-
268
-
269
-
270
-
271
-
272
-
273
-
274
-
275
-
276
-
277
-
278
-
279
-
280
-
281
-
282
-
283
-
284
-
285
-
286
-
287
-
288
-
289
-
290
-
291
-
292
-
293
-
294
-
295
-
296
-
297
-
298
-
299
-
300
-
301
-
302
-
303
-
304
-
305
-
306
-
307
-
308
-
309
-
310
-
311
-
312
-
313
-
314
-
315
-
316
-
317
-
318
-
319
-
320
-
321
-
322
-
323
-
324
-
325
-
326
-
327
-
328
-
329
-
330
-
331
-
332
-
333
-
334
-
335
-
336
-
337
-
338
-
339
-
340
-
341
-
342
-
343
-
344
-
345
-
346
-
347
-
348
-
349
-
350
-
351
-
352
-
353
-
354
-
355
-
356
-
357
-
358
-
359
-
360
-
361
-
362
-
363
-
364
-
365
-
366
-
367
-
368
-
369
-
370
-
371
-
372
-
373
-
374
-
375
-
376
-
377
-
378
-
379
-
380
-
381
-
382
-
383
-
384
-
385
-
386
-
387
-
388
-
389
-
390
-
391
-
392
-
393
-
394
-
395
-
396
 |
 |

HSBC HOLDINGS PLC
Report of the Directors: Overview (continued)
Strategic objectives and KPIs
12
Strategic
objectives
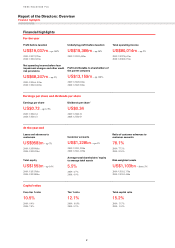
Deliver consistent earnings and superior risk-adjusted returns
Risk-adjusted revenue growth
(2010: underlying growth 15%)
Basic earnings
per ordinary share
Dividends per share
growth
10 13
-8
-30
37
'06 '07 '08 '09 '10
1.2
1.4
0.4
0.7
0.3
'06 '07 '08 '09 '10
11.0 11.1
-28.9
5.9
-46.9
'06 '07 '08 '09 '10
Measure: (percentage) increase in reporte
d
net operating income after loan impairment
and other credit risk charges since last
year.
Measure: (US$) level of basic earnings
generated per ordinary share.
Measure: (percentage) increase in
dividends per share since last year, based
on dividends paid in respect of the year to
which the dividend relates.
Target: to deliver consistent growth in ris
k
adjusted revenues.
Target: to deliver consistent growth in
basic earnings per share.
Target: to deliver sustained dividend per
share growth.
Key Performance Indicators
Outcome: reported risk-adjusted revenue
increased, primarily due to a reversal of
adverse movements in previous years on
the fair value of own debt designated at
fair value and lower loan impairment
charges. The latter also drove the increase
in underlying risk-adjusted revenue.
Outcome: Earnings per share (‘EPS’)
increased in 2010, reflecting significantly
lower adverse movements on the fair value
of own debt due to credit spreads and
lower loan impairment charges, which
resulted in an increase in reported profit.
Outcome: dividends per share increased
by 5.9%.
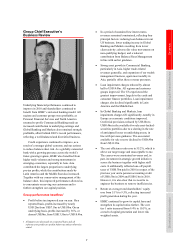
Strategic
objectives
Enhance efficiency using
economies of scale
Motivate staff to
deliver strategy
Cost efficiency Employee engagement
51.3
49.4
60.1
55.2
52.0
'06 '07 '08 '09 '10
60
67
71
63 63 64 65
75 77
74 72
68
'07 '08 '09 '10
HSBC – Actual
Financial Services Average
Global Best in Class
Measure: (percentage) total operating expenses divided by net
operating income before loan impairment and other credit risk
provisions.
Measure: (percentage) measure of employee’s emotional and
rational attachment to HSBC, a combination of advocacy,
satisfaction, commitment and pride.
Target: to be between 48% and 52%, a range within which
business is expected to remain to accommodate both returns to
shareholders and the need for continued investment in support of
future business growth.
Target: to achieve a 72% global rating in 2010, with progressive
improvement to best in class by 2011.
Key Performance Indicators
Outcome: the ratio was outside the target range in part due to
one-off costs, but also increased investment in operational
infrastructure and strategic initiatives.
Outcome: 68%, mirroring the fall in global best in class but
remaining well above the financial services average.