HSBC 2010 Annual Report Download - page 9
Download and view the complete annual report
Please find page 9 of the 2010 HSBC annual report below. You can navigate through the pages in the report by either clicking on the pages listed below, or by using the keyword search tool below to find specific information within the annual report.-
 1
1 -
 2
2 -
 3
3 -
 4
4 -
 5
5 -
 6
6 -
 7
7 -
 8
8 -
 9
9 -
 10
10 -
 11
11 -
 12
12 -
 13
13 -
 14
14 -
 15
15 -
 16
16 -
 17
17 -
 18
18 -
 19
19 -
 20
20 -
21
-
22
-
23
-
24
-
25
-
26
-
27
-
28
-
29
-
30
-
31
-
32
-
33
-
34
-
35
-
36
-
37
-
38
-
39
-
40
-
41
-
42
-
43
-
44
-
45
-
46
-
47
-
48
-
49
-
50
-
51
-
52
-
53
-
54
-
55
-
56
-
57
-
58
-
59
-
60
-
61
-
62
-
63
-
64
-
65
-
66
-
67
-
68
-
69
-
70
-
71
-
72
-
73
-
74
-
75
-
76
-
77
-
78
-
79
-
80
-
81
-
82
-
83
-
84
-
85
-
86
-
87
-
88
-
89
-
90
-
91
-
92
-
93
-
94
-
95
-
96
-
97
-
98
-
99
-
100
-
101
-
102
-
103
-
104
-
105
-
106
-
107
-
108
-
109
-
110
-
111
-
112
-
113
-
114
-
115
-
116
-
117
-
118
-
119
-
120
-
121
-
122
-
123
-
124
-
125
-
126
-
127
-
128
-
129
-
130
-
131
-
132
-
133
-
134
-
135
-
136
-
137
-
138
-
139
-
140
-
141
-
142
-
143
-
144
-
145
-
146
-
147
-
148
-
149
-
150
-
151
-
152
-
153
-
154
-
155
-
156
-
157
-
158
-
159
-
160
-
161
-
162
-
163
-
164
-
165
-
166
-
167
-
168
-
169
-
170
-
171
-
172
-
173
-
174
-
175
-
176
-
177
-
178
-
179
-
180
-
181
-
182
-
183
-
184
-
185
-
186
-
187
-
188
-
189
-
190
-
191
-
192
-
193
-
194
-
195
-
196
-
197
-
198
-
199
-
200
-
201
-
202
-
203
-
204
-
205
-
206
-
207
-
208
-
209
-
210
-
211
-
212
-
213
-
214
-
215
-
216
-
217
-
218
-
219
-
220
-
221
-
222
-
223
-
224
-
225
-
226
-
227
-
228
-
229
-
230
-
231
-
232
-
233
-
234
-
235
-
236
-
237
-
238
-
239
-
240
-
241
-
242
-
243
-
244
-
245
-
246
-
247
-
248
-
249
-
250
-
251
-
252
-
253
-
254
-
255
-
256
-
257
-
258
-
259
-
260
-
261
-
262
-
263
-
264
-
265
-
266
-
267
-
268
-
269
-
270
-
271
-
272
-
273
-
274
-
275
-
276
-
277
-
278
-
279
-
280
-
281
-
282
-
283
-
284
-
285
-
286
-
287
-
288
-
289
-
290
-
291
-
292
-
293
-
294
-
295
-
296
-
297
-
298
-
299
-
300
-
301
-
302
-
303
-
304
-
305
-
306
-
307
-
308
-
309
-
310
-
311
-
312
-
313
-
314
-
315
-
316
-
317
-
318
-
319
-
320
-
321
-
322
-
323
-
324
-
325
-
326
-
327
-
328
-
329
-
330
-
331
-
332
-
333
-
334
-
335
-
336
-
337
-
338
-
339
-
340
-
341
-
342
-
343
-
344
-
345
-
346
-
347
-
348
-
349
-
350
-
351
-
352
-
353
-
354
-
355
-
356
-
357
-
358
-
359
-
360
-
361
-
362
-
363
-
364
-
365
-
366
-
367
-
368
-
369
-
370
-
371
-
372
-
373
-
374
-
375
-
376
-
377
-
378
-
379
-
380
-
381
-
382
-
383
-
384
-
385
-
386
-
387
-
388
-
389
-
390
-
391
-
392
-
393
-
394
-
395
-
396
 |
 |

7
Overview Operating & Financial Review Governance Financial Statements Shareholder Information
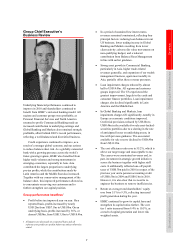
Group Chief Executive’s
Business Review
Underlying financial performance continued to
improve in 2010 and shareholders continued to
benefit from HSBC’s universal banking model. All
regions and customer groups were profitable, as
Personal Financial Services and North America
returned to profit. Commercial Banking made an
increased contribution to underlying earnings and
Global Banking and Markets also remained strongly
profitable, albeit behind 2009’s record performance,
reflecting a well-balanced and diversified business.
Credit experience continued to improve, as a
result of a stronger global economy and our actions
to reduce balance sheet risk. As a globally-connected
bank with a growing presence across the world’s
faster-growing regions, HSBC also benefited from
higher trade volumes and strong momentum in
emerging economies, especially in Asia. Asia
contributed the largest proportion to underlying
pre-tax profits, while the contributions made by
Latin America and the Middle East also increased.
Together with our conservative management of the
balance sheet, this improved performance allowed us
to concentrate on serving our customers and to
further strengthen our capital position.
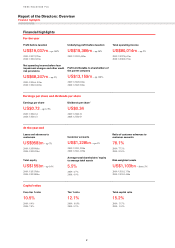
Group performance headlines1
• Profit before tax improved year on year. On a
reported basis, profits increased by nearly
US$12bn from US$7.1bn to US$19bn. On an
underlying basis, profits increased by 36%, or
almost US$5bn, from US$13.5bn to US$18.4bn.
1 All figures are discussed on a reported basis and all
references to profits are profits before tax unless otherwise
stated.
• In a period of sustained low interest rates,
revenues remained constrained, reflecting four
principal factors: reducing loan balances in our
US business; lower trading income in Global
Banking and Markets resulting from lower
client activity; adverse fair value movements on
non-qualifying hedges; and a reduced
contribution from Balance Sheet Management
in line with earlier guidance.
• Strong asset growth in Commercial Banking,
particularly in Asia, higher trade-related
revenues generally, and expansion of our wealth
management business, again most notably in
Asia, partially offset these revenue pressures.
• Loan impairment charges reduced by almost
half to US$14.0bn. All regions and customer
groups improved. The US experienced the
greatest improvement, largely in the cards and
consumer finance portfolios. Loan impairment
charges also declined significantly in Latin
America and the Middle East.
• In Global Banking and Markets, loan
impairment charges fell significantly, notably in
Europe as economic conditions improved.
Credit risk provisions reduced by US$1bn to
US$0.4bn in the available-for-sale asset-backed-
securities portfolios due to a slowing in the rate
of anticipated losses on underlying assets, in
line with previous guidance. The associated
available for sale reserve declined to US$6.4bn
from US$12.2bn.
• The cost efficiency ratio rose to 55.2%, which is
above our target range and unacceptable to me.
The causes were constrained revenues and, in
part, investment in strategic growth initiatives
across the business together with higher staff
costs. It additionally reflected one-off payroll
taxes of US$0.3bn paid in 2010 in respect of the
previous year and a pension accounting credit
of US$0.5bn in 2009 and US$0.1bn in 2010.
However, it is also clear that we need to re-
engineer the business to remove inefficiencies.
• Return on average total shareholders’ equity
rose from 5.1% to 9.5%, reflecting increased
profit generation during the year.
• HSBC continued to grow its capital base and
strengthen its capital ratios further. The core
tier 1 ratio increased from 9.4% to 10.5%, as
a result of capital generation and lower risk
weighted assets.