HSBC 2010 Annual Report Download - page 48
Download and view the complete annual report
Please find page 48 of the 2010 HSBC annual report below. You can navigate through the pages in the report by either clicking on the pages listed below, or by using the keyword search tool below to find specific information within the annual report.-
 1
1 -
2
-
3
-
4
-
5
-
6
-
7
-
8
-
9
-
10
-
11
-
12
-
13
-
14
-
15
-
16
-
17
-
18
-
19
-
20
-
21
-
22
-
23
-
24
-
25
-
26
-
27
-
28
-
29
-
30
-
31
-
32
-
33
-
34
-
35
-
36
-
37
-
 38
38 -
 39
39 -
 40
40 -
 41
41 -
 42
42 -
 43
43 -
 44
44 -
 45
45 -
 46
46 -
 47
47 -
 48
48 -
 49
49 -
 50
50 -
 51
51 -
 52
52 -
 53
53 -
 54
54 -
 55
55 -
 56
56 -
 57
57 -
 58
58 -
59
-
60
-
61
-
62
-
63
-
64
-
65
-
66
-
67
-
68
-
69
-
70
-
71
-
72
-
73
-
74
-
75
-
76
-
77
-
78
-
79
-
80
-
81
-
82
-
83
-
84
-
85
-
86
-
87
-
88
-
89
-
90
-
91
-
92
-
93
-
94
-
95
-
96
-
97
-
98
-
99
-
100
-
101
-
102
-
103
-
104
-
105
-
106
-
107
-
108
-
109
-
110
-
111
-
112
-
113
-
114
-
115
-
116
-
117
-
118
-
119
-
120
-
121
-
122
-
123
-
124
-
125
-
126
-
127
-
128
-
129
-
130
-
131
-
132
-
133
-
134
-
135
-
136
-
137
-
138
-
139
-
140
-
141
-
142
-
143
-
144
-
145
-
146
-
147
-
148
-
149
-
150
-
151
-
152
-
153
-
154
-
155
-
156
-
157
-
158
-
159
-
160
-
161
-
162
-
163
-
164
-
165
-
166
-
167
-
168
-
169
-
170
-
171
-
172
-
173
-
174
-
175
-
176
-
177
-
178
-
179
-
180
-
181
-
182
-
183
-
184
-
185
-
186
-
187
-
188
-
189
-
190
-
191
-
192
-
193
-
194
-
195
-
196
-
197
-
198
-
199
-
200
-
201
-
202
-
203
-
204
-
205
-
206
-
207
-
208
-
209
-
210
-
211
-
212
-
213
-
214
-
215
-
216
-
217
-
218
-
219
-
220
-
221
-
222
-
223
-
224
-
225
-
226
-
227
-
228
-
229
-
230
-
231
-
232
-
233
-
234
-
235
-
236
-
237
-
238
-
239
-
240
-
241
-
242
-
243
-
244
-
245
-
246
-
247
-
248
-
249
-
250
-
251
-
252
-
253
-
254
-
255
-
256
-
257
-
258
-
259
-
260
-
261
-
262
-
263
-
264
-
265
-
266
-
267
-
268
-
269
-
270
-
271
-
272
-
273
-
274
-
275
-
276
-
277
-
278
-
279
-
280
-
281
-
282
-
283
-
284
-
285
-
286
-
287
-
288
-
289
-
290
-
291
-
292
-
293
-
294
-
295
-
296
-
297
-
298
-
299
-
300
-
301
-
302
-
303
-
304
-
305
-
306
-
307
-
308
-
309
-
310
-
311
-
312
-
313
-
314
-
315
-
316
-
317
-
318
-
319
-
320
-
321
-
322
-
323
-
324
-
325
-
326
-
327
-
328
-
329
-
330
-
331
-
332
-
333
-
334
-
335
-
336
-
337
-
338
-
339
-
340
-
341
-
342
-
343
-
344
-
345
-
346
-
347
-
348
-
349
-
350
-
351
-
352
-
353
-
354
-
355
-
356
-
357
-
358
-
359
-
360
-
361
-
362
-
363
-
364
-
365
-
366
-
367
-
368
-
369
-
370
-
371
-
372
-
373
-
374
-
375
-
376
-
377
-
378
-
379
-
380
-
381
-
382
-
383
-
384
-
385
-
386
-
387
-
388
-
389
-
390
-
391
-
392
-
393
-
394
-
395
-
396
 |
 |

HSBC HOLDINGS PLC
Report of the Directors: Operating and Financial Review (continued)
Customer groups and global businesses > GPB / Other
46
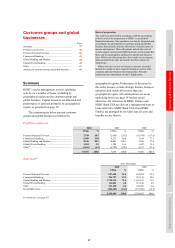
Global Private Banking
GPB works with our high net worth
clients to offer both traditional and
innovative ways to manage and preserve
wealth while optimising returns.
2010 2009 2008
US$m US$m US$m
Net interest income ........... 1,345 1,474 1,612
Net fee income .................. 1,299 1,236 1,476
Other income .................... 449 402 543
Net operating income46 ... 3,093 3,112 3,631
Impairment (charges)/
recoveries47 .................... 12 (128) (68)
Net operating income ..... 3,105 2,984 3,563
Total operating expenses .. (2,035) (1,884) (2,116)
Operating profit .............. 1,070 1,100 1,447
Income from associates48 .. (16) 8 –
Profit before tax .............. 1,054 1,108 1,447
Client assets over 6% up at
US$390bn
2009: US$367bn; 2008: US$352bn
Higher investment in GPB
operations in Asia,
Latin America and the Middle East
Best Global Wealth Manager
Euromoney Awards for Excellence 2010
Best Private Bank in
Asia
Euromoney 2011 Private
Banking Survey
Outstanding Private
Bank – Middle East
Private Banker International
Awards 2010
Strategic direction
GPB strives to be the world’s leading international private bank,
recognised for excellent client experience and global connections.
Our brand, capital strength, extensive global network and
positioning provide a strong foundation from which GPB
continues to attract and retain clients. Product and service
leadership in areas such as alternative investments, foreign
exchange, estate planning, credit and investment advice helps us
meet the complex international financial needs of individuals and
families.
We are well-positioned for sustainable long-term growth
through continuing investment in our people, integrated IT
solutions and emerging markets-focused domestic operations,
along with ensuring our cross-border business meets high
standards in the evolving regulatory environment.
For footnotes, see page 83.
Review of performance
• Reported profit before tax was US$1.1bn, 5%
below 2009 on a reported and an underlying
basis, driven by lower net interest income as
the persistent low interest rate environment
continued to affect deposit spreads and higher
operating expenses. Loan impairment charges fell
following the non-recurrence of a single specific
impairment charge in North America in 2009 and
the release of several charges made in previous
years as markets recovered.
• Net fee income and trading income rose, notably
in Asia, as improved client risk appetite led to
higher levels of activity, an increase in transaction
volumes and positive net inflows of client assets.
• Operating expenses increased, reflecting the
hiring of front-line staff to cover emerging
markets as part of a long-term strategy to further
strengthen our international network to better
serve clients, along with investment in systems
and higher compliance costs resulting from the
evolving regulatory environment.
Client assets
2010 2009
US$bn US$bn
At 1 January ....................................... 367 352
Net new money .................................. 13 (7)
Value change ...................................... 13 27
Exchange and other ............................ (3) (5)
At 31 December ................................. 390 367
• Reported client assets, which include funds under
management and cash deposits, increased by
US$23bn due to net new money inflows
compared with outflows in 2009, and favourable
market movements. Net inflows benefited from
our strength in emerging markets, newly recruited
key relationship managers, and cross-business
referrals which generated US$8bn in 2010. This
also resulted in an increase in ‘total client assets’,
the equivalent to many industry definitions of
assets under management which includes some
non-financial assets held in client trusts, from
US$460bn to US$499bn. Investor demand for
alternatives, including real estate investments,
also attracted strong inflows into HSBC
Alternative Investments Limited.
• The Family Office Partnership had a number
of successes in its first full year, producing a
complete range of corporate and personal
solutions for top tier clients and strengthening
its links with GB&M.