HSBC 2010 Annual Report Download - page 304
Download and view the complete annual report
Please find page 304 of the 2010 HSBC annual report below. You can navigate through the pages in the report by either clicking on the pages listed below, or by using the keyword search tool below to find specific information within the annual report.-
 1
1 -
2
-
3
-
4
-
5
-
6
-
7
-
8
-
9
-
10
-
11
-
12
-
13
-
14
-
15
-
16
-
17
-
18
-
19
-
20
-
21
-
22
-
23
-
24
-
25
-
26
-
27
-
28
-
29
-
30
-
31
-
32
-
33
-
34
-
35
-
36
-
37
-
38
-
39
-
40
-
41
-
42
-
43
-
44
-
45
-
46
-
47
-
48
-
49
-
50
-
51
-
52
-
53
-
54
-
55
-
56
-
57
-
58
-
59
-
60
-
61
-
62
-
63
-
64
-
65
-
66
-
67
-
68
-
69
-
70
-
71
-
72
-
73
-
74
-
75
-
76
-
77
-
78
-
79
-
80
-
81
-
82
-
83
-
84
-
85
-
86
-
87
-
88
-
89
-
90
-
91
-
92
-
93
-
94
-
95
-
96
-
97
-
98
-
99
-
100
-
101
-
102
-
103
-
104
-
105
-
106
-
107
-
108
-
109
-
110
-
111
-
112
-
113
-
114
-
115
-
116
-
117
-
118
-
119
-
120
-
121
-
122
-
123
-
124
-
125
-
126
-
127
-
128
-
129
-
130
-
131
-
132
-
133
-
134
-
135
-
136
-
137
-
138
-
139
-
140
-
141
-
142
-
143
-
144
-
145
-
146
-
147
-
148
-
149
-
150
-
151
-
152
-
153
-
154
-
155
-
156
-
157
-
158
-
159
-
160
-
161
-
162
-
163
-
164
-
165
-
166
-
167
-
168
-
169
-
170
-
171
-
172
-
173
-
174
-
175
-
176
-
177
-
178
-
179
-
180
-
181
-
182
-
183
-
184
-
185
-
186
-
187
-
188
-
189
-
190
-
191
-
192
-
193
-
194
-
195
-
196
-
197
-
198
-
199
-
200
-
201
-
202
-
203
-
204
-
205
-
206
-
207
-
208
-
209
-
210
-
211
-
212
-
213
-
214
-
215
-
216
-
217
-
218
-
219
-
220
-
221
-
222
-
223
-
224
-
225
-
226
-
227
-
228
-
229
-
230
-
231
-
232
-
233
-
234
-
235
-
236
-
237
-
238
-
239
-
240
-
241
-
242
-
243
-
244
-
245
-
246
-
247
-
248
-
249
-
250
-
251
-
252
-
253
-
254
-
255
-
256
-
257
-
258
-
259
-
260
-
261
-
262
-
263
-
264
-
265
-
266
-
267
-
268
-
269
-
270
-
271
-
272
-
273
-
274
-
275
-
276
-
277
-
278
-
279
-
280
-
281
-
282
-
283
-
284
-
285
-
286
-
287
-
288
-
289
-
290
-
291
-
292
-
293
-
 294
294 -
 295
295 -
 296
296 -
 297
297 -
 298
298 -
 299
299 -
 300
300 -
 301
301 -
 302
302 -
 303
303 -
 304
304 -
 305
305 -
 306
306 -
 307
307 -
 308
308 -
 309
309 -
 310
310 -
 311
311 -
 312
312 -
 313
313 -
 314
314 -
315
-
316
-
317
-
318
-
319
-
320
-
321
-
322
-
323
-
324
-
325
-
326
-
327
-
328
-
329
-
330
-
331
-
332
-
333
-
334
-
335
-
336
-
337
-
338
-
339
-
340
-
341
-
342
-
343
-
344
-
345
-
346
-
347
-
348
-
349
-
350
-
351
-
352
-
353
-
354
-
355
-
356
-
357
-
358
-
359
-
360
-
361
-
362
-
363
-
364
-
365
-
366
-
367
-
368
-
369
-
370
-
371
-
372
-
373
-
374
-
375
-
376
-
377
-
378
-
379
-
380
-
381
-
382
-
383
-
384
-
385
-
386
-
387
-
388
-
389
-
390
-
391
-
392
-
393
-
394
-
395
-
396
 |
 |

HSBC HOLDINGS PLC
Notes on the Financial Statements (continued)
13 – Segmental analysis / 14 – Analysis of financial assets and liabilities
302
Performance ratios
Europe
Hong
Kong
Rest of
Asia-
Pacific
Middle
East
North
America
Latin
America
Total
% % % % % % %
2010
Share of HSBC’s profit before
tax ........................................... 22.6 29.9 31.0 4.7 2.4 9.4 100.0
Cost efficiency ratio ................... 67.9 43.4 55.7 44.7 48.8 65.7 55.2
2009
Share of HSBC’s profit/(loss)
before tax ................................ 56.7 71.0 59.3 6.4 (109.3) 15.9 100.0
Cost efficiency ratio ................... 59.4 41.7 55.6 38.6 51.5 59.6 52.0
2008
Share of HSBC’s profit/(loss)
before tax ................................ 116.7 58.7 50.7 18.8 (166.8) 21.9 100.0
Cost efficiency ratio ................... 52.4 38.8 52.4 35.9 94.1 57.0 60.1
Balance sheet information
Europe
Hong
Kong
Rest of
Asia-
Pacific
Middle
East
North
America
Latin
America
Intra-
HSBC
items
Total
US$m US$m US$m US$m US$m US$m US$m US$m
At 31 December 2010
Loans and advances to
customers (net) ....................... 435,799 140,691 108,731 24,626 190,532 57,987 – 958,366
Interests in associates and
joint ventures .......................... 186 207 15,035 1,661 104 5 – 17,198
Total assets .................................. 1,249,527 429,565 278,062 52,757 492,487 139,938 (187,647) 2,454,689
Customer accounts ...................... 491,563 297,484 158,155 33,511 158,486 88,526 – 1,227,725
Total liabilities ............................ 1,189,996 422,101 246,989 45,379 459,301 123,655 (187,647) 2,299,774
Capital expenditure incurred1 ..... 865 836 168 46 774 788 – 3,477
At 31 December 2009
Loans and advances to
customers (net) ....................... 439,481 99,381 80,043 22,844 206,853 47,629 – 896,231
Interests in associates and
joint ventures .......................... 147 157 11,083 1,573 42 9 – 13,011
Total assets .................................. 1,268,600 399,243 222,139 48,107 475,014 115,967 (164,618) 2,364,452
Customer accounts ...................... 495,019 275,441 133,999 32,529 149,157 72,889 – 1,159,034
Total liabilities ............................ 1,213,907 384,912 203,243 42,325 447,530 101,492 (164,618) 2,228,791
Capital expenditure incurred1 ..... 983 290 159 102 658 540 – 2,732
At 31 December 2008
Loans and advances to
customers (net) ....................... 426,191 100,220 80,661 27,295 256,214 42,287 – 932,868
Interests in associates and
joint ventures .......................... 137 153 9,728 1,383 128 8 – 11,537
Total assets .................................. 1,392,049 414,484 225,573 50,952 596,302 102,946 (254,841) 2,527,465
Customer accounts ...................... 502,476 250,517 124,194 35,165 143,532 59,443 – 1,115,327
Total liabilities ............................ 1,361,960 400,637 210,478 45,416 571,657 91,929 (254,841) 2,427,236
Capital expenditure incurred1 ..... 2,078 440 426 85 726 617 – 4,372
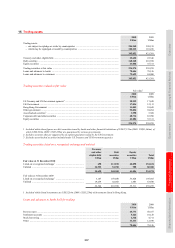
1 Expenditure incurred on property, plant and equipment and other intangible assets. Excludes assets acquired as part of business
combinations and goodwill.