HSBC 2010 Annual Report Download - page 305
Download and view the complete annual report
Please find page 305 of the 2010 HSBC annual report below. You can navigate through the pages in the report by either clicking on the pages listed below, or by using the keyword search tool below to find specific information within the annual report.-
 1
1 -
2
-
3
-
4
-
5
-
6
-
7
-
8
-
9
-
10
-
11
-
12
-
13
-
14
-
15
-
16
-
17
-
18
-
19
-
20
-
21
-
22
-
23
-
24
-
25
-
26
-
27
-
28
-
29
-
30
-
31
-
32
-
33
-
34
-
35
-
36
-
37
-
38
-
39
-
40
-
41
-
42
-
43
-
44
-
45
-
46
-
47
-
48
-
49
-
50
-
51
-
52
-
53
-
54
-
55
-
56
-
57
-
58
-
59
-
60
-
61
-
62
-
63
-
64
-
65
-
66
-
67
-
68
-
69
-
70
-
71
-
72
-
73
-
74
-
75
-
76
-
77
-
78
-
79
-
80
-
81
-
82
-
83
-
84
-
85
-
86
-
87
-
88
-
89
-
90
-
91
-
92
-
93
-
94
-
95
-
96
-
97
-
98
-
99
-
100
-
101
-
102
-
103
-
104
-
105
-
106
-
107
-
108
-
109
-
110
-
111
-
112
-
113
-
114
-
115
-
116
-
117
-
118
-
119
-
120
-
121
-
122
-
123
-
124
-
125
-
126
-
127
-
128
-
129
-
130
-
131
-
132
-
133
-
134
-
135
-
136
-
137
-
138
-
139
-
140
-
141
-
142
-
143
-
144
-
145
-
146
-
147
-
148
-
149
-
150
-
151
-
152
-
153
-
154
-
155
-
156
-
157
-
158
-
159
-
160
-
161
-
162
-
163
-
164
-
165
-
166
-
167
-
168
-
169
-
170
-
171
-
172
-
173
-
174
-
175
-
176
-
177
-
178
-
179
-
180
-
181
-
182
-
183
-
184
-
185
-
186
-
187
-
188
-
189
-
190
-
191
-
192
-
193
-
194
-
195
-
196
-
197
-
198
-
199
-
200
-
201
-
202
-
203
-
204
-
205
-
206
-
207
-
208
-
209
-
210
-
211
-
212
-
213
-
214
-
215
-
216
-
217
-
218
-
219
-
220
-
221
-
222
-
223
-
224
-
225
-
226
-
227
-
228
-
229
-
230
-
231
-
232
-
233
-
234
-
235
-
236
-
237
-
238
-
239
-
240
-
241
-
242
-
243
-
244
-
245
-
246
-
247
-
248
-
249
-
250
-
251
-
252
-
253
-
254
-
255
-
256
-
257
-
258
-
259
-
260
-
261
-
262
-
263
-
264
-
265
-
266
-
267
-
268
-
269
-
270
-
271
-
272
-
273
-
274
-
275
-
276
-
277
-
278
-
279
-
280
-
281
-
282
-
283
-
284
-
285
-
286
-
287
-
288
-
289
-
290
-
291
-
292
-
293
-
294
-
 295
295 -
 296
296 -
 297
297 -
 298
298 -
 299
299 -
 300
300 -
 301
301 -
 302
302 -
 303
303 -
 304
304 -
 305
305 -
 306
306 -
 307
307 -
 308
308 -
 309
309 -
 310
310 -
 311
311 -
 312
312 -
 313
313 -
 314
314 -
 315
315 -
316
-
317
-
318
-
319
-
320
-
321
-
322
-
323
-
324
-
325
-
326
-
327
-
328
-
329
-
330
-
331
-
332
-
333
-
334
-
335
-
336
-
337
-
338
-
339
-
340
-
341
-
342
-
343
-
344
-
345
-
346
-
347
-
348
-
349
-
350
-
351
-
352
-
353
-
354
-
355
-
356
-
357
-
358
-
359
-
360
-
361
-
362
-
363
-
364
-
365
-
366
-
367
-
368
-
369
-
370
-
371
-
372
-
373
-
374
-
375
-
376
-
377
-
378
-
379
-
380
-
381
-
382
-
383
-
384
-
385
-
386
-
387
-
388
-
389
-
390
-
391
-
392
-
393
-
394
-
395
-
396
 |
 |

303
Overview Operating & Financial Review Governance Financial Statements Shareholder Information
Other financial information
Net operating income by customer group and global business
Personal
Financial
Services
Commercial
Banking
Global
Banking
& Markets
Global
Private
Banking Other1
Intra-
HSBC
items
Total
US$m US$m US$m US$m US$m US$m US$m
2010
Net operating income .................. 21,317 12,029 18,957 3,105 4,663 (5,863) 54,208
External .................................. 19,529 11,419 22,090 2,194 (1,024) – 54,208
Internal .................................... 1,788 610 (3,133) 911 5,687 (5,863) –
2009
Net operating income .................. 15,513 9,571 18,652 2,984 (2,031) (4,996) 39,693
External .................................. 13,804 9,285 21,383 2,275 (7,054) – 39,693
Internal .................................... 1,709 286 (2,731) 709 5,023 (4,996) –
2008
Net operating income .................. 20,269 13,144 12,047 3,563 12,290 (4,568) 56,745
External .................................. 15,023 13,080 17,739 2,231 8,672 – 56,745
Internal .................................... 5,246 64 (5,692) 1,332 3,618 (4,568) –
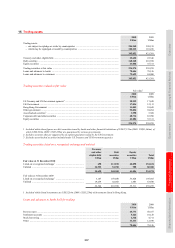
1 The main items reported in the ‘Other’ category are certain property activities, unallocated investment activities, centrally held
investment companies, movements in fair value of own debt and HSBC’s holding company and financing operations. The ‘Other’
category also includes gains and losses on the disposal of certain significant subsidiaries or business units.
Information by country
2010 2009 2008
External net
operating
income1
Non-
current
assets2
External net
operating
income1
Non-
current
assets2
External net
operating
income1
Non-
current
assets2
US$m US$m US$m US$m US$m US$m
UK ....................................................................... 11,467 19,661 9,958 19,704 15,789 12,491
Hong Kong ......................................................... 9,170 4,630 8,352 3,374 8,205 3,527
USA .................................................................... 6,098 6,669 (1,042) 5,499 2,862 4,660
France ................................................................. 3,185 10,914 3,322 11,782 6,457 11,862
Brazil ................................................................... 4,506 2,025 3,368 1,868 3,886 1,421
Other countries ................................................... 19,782 29,747 15,735 25,557 19,546 23,020
54,208 73,646 39,693 67,784 56,745 56,981
1 External net operating income is attributed to countries on the basis of the location of the branch responsible for reporting the results or
advancing the funds.
2 Non-current assets consist of property, plant and equipment, goodwill, other intangible assets, interests in associates and joint ventures
and certain other assets expected to be recovered more than twelve months after the reporting period.
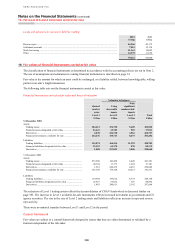
14 Analysis of financial assets and liabilities by measurement basis
Financial assets and financial liabilities are measured on an ongoing basis either at fair value or at amortised cost. The
summary of significant accounting policies in Note 2 describes how the classes of financial instruments are measured,
and how income and expenses, including fair value gains and losses, are recognised. The following table analyses the
carrying amounts of the financial assets and liabilities by category as defined in IAS 39 and by balance sheet heading.