HSBC 2010 Annual Report Download - page 307
Download and view the complete annual report
Please find page 307 of the 2010 HSBC annual report below. You can navigate through the pages in the report by either clicking on the pages listed below, or by using the keyword search tool below to find specific information within the annual report.-
 1
1 -
2
-
3
-
4
-
5
-
6
-
7
-
8
-
9
-
10
-
11
-
12
-
13
-
14
-
15
-
16
-
17
-
18
-
19
-
20
-
21
-
22
-
23
-
24
-
25
-
26
-
27
-
28
-
29
-
30
-
31
-
32
-
33
-
34
-
35
-
36
-
37
-
38
-
39
-
40
-
41
-
42
-
43
-
44
-
45
-
46
-
47
-
48
-
49
-
50
-
51
-
52
-
53
-
54
-
55
-
56
-
57
-
58
-
59
-
60
-
61
-
62
-
63
-
64
-
65
-
66
-
67
-
68
-
69
-
70
-
71
-
72
-
73
-
74
-
75
-
76
-
77
-
78
-
79
-
80
-
81
-
82
-
83
-
84
-
85
-
86
-
87
-
88
-
89
-
90
-
91
-
92
-
93
-
94
-
95
-
96
-
97
-
98
-
99
-
100
-
101
-
102
-
103
-
104
-
105
-
106
-
107
-
108
-
109
-
110
-
111
-
112
-
113
-
114
-
115
-
116
-
117
-
118
-
119
-
120
-
121
-
122
-
123
-
124
-
125
-
126
-
127
-
128
-
129
-
130
-
131
-
132
-
133
-
134
-
135
-
136
-
137
-
138
-
139
-
140
-
141
-
142
-
143
-
144
-
145
-
146
-
147
-
148
-
149
-
150
-
151
-
152
-
153
-
154
-
155
-
156
-
157
-
158
-
159
-
160
-
161
-
162
-
163
-
164
-
165
-
166
-
167
-
168
-
169
-
170
-
171
-
172
-
173
-
174
-
175
-
176
-
177
-
178
-
179
-
180
-
181
-
182
-
183
-
184
-
185
-
186
-
187
-
188
-
189
-
190
-
191
-
192
-
193
-
194
-
195
-
196
-
197
-
198
-
199
-
200
-
201
-
202
-
203
-
204
-
205
-
206
-
207
-
208
-
209
-
210
-
211
-
212
-
213
-
214
-
215
-
216
-
217
-
218
-
219
-
220
-
221
-
222
-
223
-
224
-
225
-
226
-
227
-
228
-
229
-
230
-
231
-
232
-
233
-
234
-
235
-
236
-
237
-
238
-
239
-
240
-
241
-
242
-
243
-
244
-
245
-
246
-
247
-
248
-
249
-
250
-
251
-
252
-
253
-
254
-
255
-
256
-
257
-
258
-
259
-
260
-
261
-
262
-
263
-
264
-
265
-
266
-
267
-
268
-
269
-
270
-
271
-
272
-
273
-
274
-
275
-
276
-
277
-
278
-
279
-
280
-
281
-
282
-
283
-
284
-
285
-
286
-
287
-
288
-
289
-
290
-
291
-
292
-
293
-
294
-
295
-
296
-
 297
297 -
 298
298 -
 299
299 -
 300
300 -
 301
301 -
 302
302 -
 303
303 -
 304
304 -
 305
305 -
 306
306 -
 307
307 -
 308
308 -
 309
309 -
 310
310 -
 311
311 -
 312
312 -
 313
313 -
 314
314 -
 315
315 -
 316
316 -
 317
317 -
318
-
319
-
320
-
321
-
322
-
323
-
324
-
325
-
326
-
327
-
328
-
329
-
330
-
331
-
332
-
333
-
334
-
335
-
336
-
337
-
338
-
339
-
340
-
341
-
342
-
343
-
344
-
345
-
346
-
347
-
348
-
349
-
350
-
351
-
352
-
353
-
354
-
355
-
356
-
357
-
358
-
359
-
360
-
361
-
362
-
363
-
364
-
365
-
366
-
367
-
368
-
369
-
370
-
371
-
372
-
373
-
374
-
375
-
376
-
377
-
378
-
379
-
380
-
381
-
382
-
383
-
384
-
385
-
386
-
387
-
388
-
389
-
390
-
391
-
392
-
393
-
394
-
395
-
396
 |
 |

305
Shareholder Information Financial Statements Governance Operating & Financial Review Overview
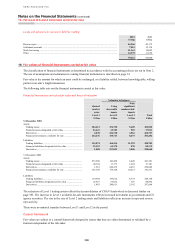
At 31 December 2009
Held for
trading
Designated
at fair value
Held-to-
maturity
securities
Available-
for-sale
securities
Financial
assets and
liabilities at
amortised
cost
Derivatives
designated
as fair value
hedging
instruments
Derivatives
designated
as cash flow
hedging
instruments Total
US$m US$m US$m US$m US$m US$m US$m US$m
Financial assets
Cash and balances at central banks .................................................................................. – – – – 60,655 – – 60,655
Items in the course of collection from other banks .......................................................... – – – – 6,395 – – 6,395
Hong Kong Government certificates of indebtedness ..................................................... – – – 17,463 – – 17,463
Trading assets ................................................................................................................... 421,381 – – – – – – 421,381
Financial assets designated at fair value .......................................................................... – 37,181 – – – – – 37,181
Derivatives ........................................................................................................................ 245,685 – – – – 584 4,617 250,886
Loans and advances to banks ........................................................................................... – – – – 179,781 – – 179,781
Loans and advances to customers .................................................................................... – – – – 896,231 – – 896,231
Financial investments ....................................................................................................... – – 17,626 351,532 – – – 369,158
Other assets ....................................................................................................................... – – – 3 26,114 – – 26,117
Accrued income ................................................................................................................ – – – – 10,256 – – 10,256
Total financial assets ........................................................................................................ 667,066 37,181 17,626 351,535 1,196,895 584 4,617 2,275,504
Financial liabilities
Hong Kong currency notes in circulation ........................................................................ – – – – 17,463 – – 17,463
Deposits by banks ............................................................................................................. – – – – 124,872 – – 124,872
Customer accounts ............................................................................................................ – – – – 1,159,034 – – 1,159,034
Items in the course of transmission to other banks .......................................................... – – – – 5,734 – – 5,734
Trading liabilities .............................................................................................................. 268,130 – – – – – – 268,130
Financial liabilities designated at fair value ..................................................................... – 80,092 – – – – – 80,092
Derivatives ........................................................................................................................ 244,072 – – – – 1,085 2,489 247,646
Debt securities in issue ..................................................................................................... – – – – 146,896 – – 146,896
Other liabilities ................................................................................................................. – – – – 66,169 – – 66,169
Accruals ............................................................................................................................ – – – – 11,644 – – 11,644
Subordinated liabilities ..................................................................................................... – – – – 30,478 – – 30,478
Total financial liabilities ................................................................................................... 512,202 80,092 – – 1,562,290 1,085 2,489 2,158,158