HSBC 2010 Annual Report Download - page 27
Download and view the complete annual report
Please find page 27 of the 2010 HSBC annual report below. You can navigate through the pages in the report by either clicking on the pages listed below, or by using the keyword search tool below to find specific information within the annual report.-
 1
1 -
2
-
3
-
4
-
5
-
6
-
7
-
8
-
9
-
10
-
11
-
12
-
13
-
14
-
15
-
16
-
 17
17 -
 18
18 -
 19
19 -
 20
20 -
 21
21 -
 22
22 -
 23
23 -
 24
24 -
 25
25 -
 26
26 -
 27
27 -
 28
28 -
 29
29 -
 30
30 -
 31
31 -
 32
32 -
 33
33 -
 34
34 -
 35
35 -
 36
36 -
 37
37 -
38
-
39
-
40
-
41
-
42
-
43
-
44
-
45
-
46
-
47
-
48
-
49
-
50
-
51
-
52
-
53
-
54
-
55
-
56
-
57
-
58
-
59
-
60
-
61
-
62
-
63
-
64
-
65
-
66
-
67
-
68
-
69
-
70
-
71
-
72
-
73
-
74
-
75
-
76
-
77
-
78
-
79
-
80
-
81
-
82
-
83
-
84
-
85
-
86
-
87
-
88
-
89
-
90
-
91
-
92
-
93
-
94
-
95
-
96
-
97
-
98
-
99
-
100
-
101
-
102
-
103
-
104
-
105
-
106
-
107
-
108
-
109
-
110
-
111
-
112
-
113
-
114
-
115
-
116
-
117
-
118
-
119
-
120
-
121
-
122
-
123
-
124
-
125
-
126
-
127
-
128
-
129
-
130
-
131
-
132
-
133
-
134
-
135
-
136
-
137
-
138
-
139
-
140
-
141
-
142
-
143
-
144
-
145
-
146
-
147
-
148
-
149
-
150
-
151
-
152
-
153
-
154
-
155
-
156
-
157
-
158
-
159
-
160
-
161
-
162
-
163
-
164
-
165
-
166
-
167
-
168
-
169
-
170
-
171
-
172
-
173
-
174
-
175
-
176
-
177
-
178
-
179
-
180
-
181
-
182
-
183
-
184
-
185
-
186
-
187
-
188
-
189
-
190
-
191
-
192
-
193
-
194
-
195
-
196
-
197
-
198
-
199
-
200
-
201
-
202
-
203
-
204
-
205
-
206
-
207
-
208
-
209
-
210
-
211
-
212
-
213
-
214
-
215
-
216
-
217
-
218
-
219
-
220
-
221
-
222
-
223
-
224
-
225
-
226
-
227
-
228
-
229
-
230
-
231
-
232
-
233
-
234
-
235
-
236
-
237
-
238
-
239
-
240
-
241
-
242
-
243
-
244
-
245
-
246
-
247
-
248
-
249
-
250
-
251
-
252
-
253
-
254
-
255
-
256
-
257
-
258
-
259
-
260
-
261
-
262
-
263
-
264
-
265
-
266
-
267
-
268
-
269
-
270
-
271
-
272
-
273
-
274
-
275
-
276
-
277
-
278
-
279
-
280
-
281
-
282
-
283
-
284
-
285
-
286
-
287
-
288
-
289
-
290
-
291
-
292
-
293
-
294
-
295
-
296
-
297
-
298
-
299
-
300
-
301
-
302
-
303
-
304
-
305
-
306
-
307
-
308
-
309
-
310
-
311
-
312
-
313
-
314
-
315
-
316
-
317
-
318
-
319
-
320
-
321
-
322
-
323
-
324
-
325
-
326
-
327
-
328
-
329
-
330
-
331
-
332
-
333
-
334
-
335
-
336
-
337
-
338
-
339
-
340
-
341
-
342
-
343
-
344
-
345
-
346
-
347
-
348
-
349
-
350
-
351
-
352
-
353
-
354
-
355
-
356
-
357
-
358
-
359
-
360
-
361
-
362
-
363
-
364
-
365
-
366
-
367
-
368
-
369
-
370
-
371
-
372
-
373
-
374
-
375
-
376
-
377
-
378
-
379
-
380
-
381
-
382
-
383
-
384
-
385
-
386
-
387
-
388
-
389
-
390
-
391
-
392
-
393
-
394
-
395
-
396
 |
 |

25
Overview Operating & Financial Review Governance Financial Statements Shareholder Information
We actively managed down some of our higher
risk portfolios in all regions and enhanced credit
quality through tighter underwriting and increased
focus on the sale of secured products to customers
where we already held a banking relationship.
Loan impairment charges in our CMB and GB&M
businesses fell as economic conditions improved and
we recognised fewer large loan impairment charges
against specific clients than in 2009.
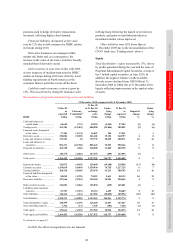
Loan impairment charges and other credit
risk provisions of US$14bn were 48% or
US$12.8bn lower than in 2009.
Impairments on available-for-sale debt
securities declined markedly to US$472m from the
US$1.5bn reported in 2009, mainly reflecting a
slowing in the rate of anticipated losses in the
underlying collateral pools.
The most significant decline in loan impairment
charges was in our HSBC Finance portfolios in
the US, where lending balances reduced and
delinquency levels improved.
Loan impairment charges and other credit risk
provisions in the US declined by 48% to US$7.9bn,
the lowest level since 2006, representing 57% of the
Group’s total reduction compared with 2009. This
mainly occurred in the US PFS business, where loan
impairment charges declined by US$6.1bn to
US$8.0bn, primarily in the Card and Retail Services
business of HSBC Finance and, to a lesser extent, in
the run-off consumer finance portfolios.
In Cards and Retail Services, loan impairment
charges declined by 57% to US$2.2bn. This
improvement reflected the continuing effects of
additional steps taken from the fourth quarter
of 2007 to manage risk, including tightening
underwriting criteria, lowering credit limits and
reducing the number of active cards. An increased
focus by our customers on reducing outstanding
credit card debt helped improve delinquency levels.
Loan impairment charges in our Consumer
Lending and Mortgage Services businesses declined
by 29% to US$5.7bn, due to the continued run-off
of lending balances in these portfolios and lower
delinquency balances. Total loss severities on
foreclosed loans improved compared with 2009,
reflecting an increase in the number of properties for
which we accepted a deed in lieu of foreclosure or a
short sale, both of which result in lower losses
compared with loans which are subject to a formal
foreclosure process.
During 2010, state and federal prosecutors
announced investigations into foreclosure practices
of certain mortgage service providers. As a result,
we expect that the scrutiny of documents will
increase, and in some states additional verification of
information will be required. If these trends continue
there may be delays in their processing. See page 83
for more information on the investigation into US
foreclosure practices.
In HSBC Bank USA, loan impairment charges
in PFS fell by 92% to US$50m, reflecting lower
lending balances and improved credit quality in the
residential mortgage portfolio.
In GB&M in the US, a net release of loan
impairment charges and other credit risk provisions
reflected the improved credit environment and a
release of impairments of available-for-sale ABSs as
mentioned previously. In CMB, loan impairment
charges declined by US$194m as the improved
economic conditions resulted in credit upgrades on
certain accounts, and fewer downgrades across all
business lines.
In the UK, loan impairment charges in PFS and
CMB declined as economic conditions improved and
interest rates remained at low levels, resulting in an
improvement in delinquency levels. In PFS, loan
impairment charges fell by 35% to US$1.1bn as we
actively reduced our exposure to unsecured lending,
while collections increased mainly due to programmes
implemented to improve performance. In the UK
secured lending book, credit quality continued to be
high and loan impairment charges remained at low
levels. In CMB, loan impairment charges declined
by US$159m due to strengthened credit risk
management and improved collections, notably in
the UK property, retail and service sectors.
Loan impairment charges and other credit
provisions fell markedly in GB&M, reflecting the
improved credit outlook, loan restructuring activity
and the non-recurrence of significant charges against
a small number of clients in the financial and
property sectors. Credit risk provisions on certain
available-for-sale ABSs also reduced.
Loan impairment charges and other credit risk
provisions in Latin America declined by 44% to
US$1.5bn. In PFS, loan impairment charges of
US$1.2bn were 45% lower, mainly in Mexico due to
a reduction in balances and improved delinquency
rates in our credit card portfolio. In Brazil, they also
declined as we managed down the size of certain
consumer finance portfolios and economic
conditions improved. In 2010, initiatives taken in the
region to improve the quality of the loan portfolios
continued. These steps included the tightening of
underwriting criteria, reducing and, in some