HSBC 2010 Annual Report Download - page 47
Download and view the complete annual report
Please find page 47 of the 2010 HSBC annual report below. You can navigate through the pages in the report by either clicking on the pages listed below, or by using the keyword search tool below to find specific information within the annual report.-
 1
1 -
2
-
3
-
4
-
5
-
6
-
7
-
8
-
9
-
10
-
11
-
12
-
13
-
14
-
15
-
16
-
17
-
18
-
19
-
20
-
21
-
22
-
23
-
24
-
25
-
26
-
27
-
28
-
29
-
30
-
31
-
32
-
33
-
34
-
35
-
36
-
 37
37 -
 38
38 -
 39
39 -
 40
40 -
 41
41 -
 42
42 -
 43
43 -
 44
44 -
 45
45 -
 46
46 -
 47
47 -
 48
48 -
 49
49 -
 50
50 -
 51
51 -
 52
52 -
 53
53 -
 54
54 -
 55
55 -
 56
56 -
 57
57 -
58
-
59
-
60
-
61
-
62
-
63
-
64
-
65
-
66
-
67
-
68
-
69
-
70
-
71
-
72
-
73
-
74
-
75
-
76
-
77
-
78
-
79
-
80
-
81
-
82
-
83
-
84
-
85
-
86
-
87
-
88
-
89
-
90
-
91
-
92
-
93
-
94
-
95
-
96
-
97
-
98
-
99
-
100
-
101
-
102
-
103
-
104
-
105
-
106
-
107
-
108
-
109
-
110
-
111
-
112
-
113
-
114
-
115
-
116
-
117
-
118
-
119
-
120
-
121
-
122
-
123
-
124
-
125
-
126
-
127
-
128
-
129
-
130
-
131
-
132
-
133
-
134
-
135
-
136
-
137
-
138
-
139
-
140
-
141
-
142
-
143
-
144
-
145
-
146
-
147
-
148
-
149
-
150
-
151
-
152
-
153
-
154
-
155
-
156
-
157
-
158
-
159
-
160
-
161
-
162
-
163
-
164
-
165
-
166
-
167
-
168
-
169
-
170
-
171
-
172
-
173
-
174
-
175
-
176
-
177
-
178
-
179
-
180
-
181
-
182
-
183
-
184
-
185
-
186
-
187
-
188
-
189
-
190
-
191
-
192
-
193
-
194
-
195
-
196
-
197
-
198
-
199
-
200
-
201
-
202
-
203
-
204
-
205
-
206
-
207
-
208
-
209
-
210
-
211
-
212
-
213
-
214
-
215
-
216
-
217
-
218
-
219
-
220
-
221
-
222
-
223
-
224
-
225
-
226
-
227
-
228
-
229
-
230
-
231
-
232
-
233
-
234
-
235
-
236
-
237
-
238
-
239
-
240
-
241
-
242
-
243
-
244
-
245
-
246
-
247
-
248
-
249
-
250
-
251
-
252
-
253
-
254
-
255
-
256
-
257
-
258
-
259
-
260
-
261
-
262
-
263
-
264
-
265
-
266
-
267
-
268
-
269
-
270
-
271
-
272
-
273
-
274
-
275
-
276
-
277
-
278
-
279
-
280
-
281
-
282
-
283
-
284
-
285
-
286
-
287
-
288
-
289
-
290
-
291
-
292
-
293
-
294
-
295
-
296
-
297
-
298
-
299
-
300
-
301
-
302
-
303
-
304
-
305
-
306
-
307
-
308
-
309
-
310
-
311
-
312
-
313
-
314
-
315
-
316
-
317
-
318
-
319
-
320
-
321
-
322
-
323
-
324
-
325
-
326
-
327
-
328
-
329
-
330
-
331
-
332
-
333
-
334
-
335
-
336
-
337
-
338
-
339
-
340
-
341
-
342
-
343
-
344
-
345
-
346
-
347
-
348
-
349
-
350
-
351
-
352
-
353
-
354
-
355
-
356
-
357
-
358
-
359
-
360
-
361
-
362
-
363
-
364
-
365
-
366
-
367
-
368
-
369
-
370
-
371
-
372
-
373
-
374
-
375
-
376
-
377
-
378
-
379
-
380
-
381
-
382
-
383
-
384
-
385
-
386
-
387
-
388
-
389
-
390
-
391
-
392
-
393
-
394
-
395
-
396
 |
 |

45
Overview Operating & Financial Review Governance Financial Statements Shareholder Information
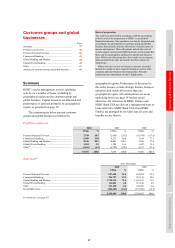
Management view of total operating income
2010
US$m
2009
US$m
2008
US$m
Global Markets50 ............... 9,173 10,364 2,676
Credit ............................ 1,649 2,330 (5,502)
Rates ............................. 2,052 2,648 2,033
Foreign Exchange ......... 2,752 2,979 3,842
Equities ......................... 755 641 (64)
Securities Services51 ..... 1,511 1,420 2,116
Asset and Structured
Finance ....................... 454 346 251
Global Banking ................. 4,621 4,630 5,718
Financing and Equity
Capital Markets ......... 2,852 3,070 3,572
Payments and Cash
Management52 ............ 1,133 1,053 1,665
Other transaction
services53 .................... 636 507 481
Balance Sheet
Management54 ............... 4,102 5,390 3,618
Global Asset
Management ................. 1,077 939 934
Principal Investments ....... 319 42 (415)
Other55 ............................... 655 455 987
Total operating income ..... 19,947 21,820 13,518
Comparative information has been adjusted to reflect the
current management view.
For footnotes, see page 83.
delivery of certain staff benefits in the main UK
pension scheme in 2009, higher support costs
and continued investment in strategic initiatives
being undertaken to drive future revenue
growth. These included the development of
Prime Services and equity market capabilities
and the expansion of the Rates and Foreign
Exchange e-commerce platforms. The
percentage of total reported compensation pool
allocated in respect of performance in 2010 to
revenues net of loan impairment charges
(excluding payroll taxes levied on 2009
bonuses) remained consistent with 2009 on a
reported basis.
• Global Markets’ revenues were second only to
the results recorded in 2009, demonstrating the
continuing strength of our client-facing
businesses. Trading income declined, driven by
increased competition and reduced margins
across core products. Credit and Rates were
adversely affected by less favourable market
conditions as European sovereign debt concerns
resulted in increased economic uncertainty in
the eurozone. Foreign Exchange revenues were
lower, reflecting spread compression in the
more competitive trading environment and a
decline in market volatility. Investment in the
Equities business, particularly the enhancement
of the sales and trading platforms, led to
increased market share in our target markets
despite lower market volumes and increased
competition. Securities Services income grew
by 4%, with particularly strong performances in
Asia driven by increasing market values and
Latin America due to higher interest income.
Asset and Structured Finance reported higher
revenues from increased deal activity during the
year.
• Global Banking produced a robust performance
as it continued the strategy of focusing on key
client relationships to drive market share growth
in event-driven and other ancillary businesses.
A decrease in revenues from Financing and
Equity Capital Markets was due to the adverse
effect of continued spread compression. Higher
project and export finance revenues were driven
by increased deal volumes, while growth in
revenue and market share was achieved in the
advisory business. Equity Capital Markets
revenues fell as total deal values declined due
to a reduction in client activity. Despite the
adverse effect of the continued low interest rate
environment, Payments and Cash Management
delivered a 6% increase in revenue driven by
strong growth in transaction-driven fee income
and customer account balances in Asia.
• Revenues in Balance Sheet Management
remained high by historical standards but, as
expected, declined in 2010 as higher-yielding
positions matured and the opportunity for
reinvestment was limited by the prevailing low
interest rate environment and flatter yield
curves.
• Robust revenue growth was reported in Global
Asset Management. Higher management fee
income was recorded across all regions, most
notably in our emerging markets businesses.
Funds under management (‘FuM’) reached a
year-end high of US$439bn at 31 December
2010 of which emerging markets FuM, in
countries outside North America, Western
Europe, Japan and Australia, were US$145bn.
Total FuM grew by 4% compared with 2009,
benefiting from positive net inflows of
US$16bn and strengthening market
performance. New funds launched in the year
included the Global High Income Fund and the
MultiAlpha Global High Yield Bond Fund.
• Principal Investments reported an increase
in revenues as improved market conditions
resulted in higher gains on sale and a reduction
in impairments.