HSBC 2010 Annual Report Download - page 28
Download and view the complete annual report
Please find page 28 of the 2010 HSBC annual report below. You can navigate through the pages in the report by either clicking on the pages listed below, or by using the keyword search tool below to find specific information within the annual report.-
 1
1 -
2
-
3
-
4
-
5
-
6
-
7
-
8
-
9
-
10
-
11
-
12
-
13
-
14
-
15
-
16
-
17
-
 18
18 -
 19
19 -
 20
20 -
 21
21 -
 22
22 -
 23
23 -
 24
24 -
 25
25 -
 26
26 -
 27
27 -
 28
28 -
 29
29 -
 30
30 -
 31
31 -
 32
32 -
 33
33 -
 34
34 -
 35
35 -
 36
36 -
 37
37 -
 38
38 -
39
-
40
-
41
-
42
-
43
-
44
-
45
-
46
-
47
-
48
-
49
-
50
-
51
-
52
-
53
-
54
-
55
-
56
-
57
-
58
-
59
-
60
-
61
-
62
-
63
-
64
-
65
-
66
-
67
-
68
-
69
-
70
-
71
-
72
-
73
-
74
-
75
-
76
-
77
-
78
-
79
-
80
-
81
-
82
-
83
-
84
-
85
-
86
-
87
-
88
-
89
-
90
-
91
-
92
-
93
-
94
-
95
-
96
-
97
-
98
-
99
-
100
-
101
-
102
-
103
-
104
-
105
-
106
-
107
-
108
-
109
-
110
-
111
-
112
-
113
-
114
-
115
-
116
-
117
-
118
-
119
-
120
-
121
-
122
-
123
-
124
-
125
-
126
-
127
-
128
-
129
-
130
-
131
-
132
-
133
-
134
-
135
-
136
-
137
-
138
-
139
-
140
-
141
-
142
-
143
-
144
-
145
-
146
-
147
-
148
-
149
-
150
-
151
-
152
-
153
-
154
-
155
-
156
-
157
-
158
-
159
-
160
-
161
-
162
-
163
-
164
-
165
-
166
-
167
-
168
-
169
-
170
-
171
-
172
-
173
-
174
-
175
-
176
-
177
-
178
-
179
-
180
-
181
-
182
-
183
-
184
-
185
-
186
-
187
-
188
-
189
-
190
-
191
-
192
-
193
-
194
-
195
-
196
-
197
-
198
-
199
-
200
-
201
-
202
-
203
-
204
-
205
-
206
-
207
-
208
-
209
-
210
-
211
-
212
-
213
-
214
-
215
-
216
-
217
-
218
-
219
-
220
-
221
-
222
-
223
-
224
-
225
-
226
-
227
-
228
-
229
-
230
-
231
-
232
-
233
-
234
-
235
-
236
-
237
-
238
-
239
-
240
-
241
-
242
-
243
-
244
-
245
-
246
-
247
-
248
-
249
-
250
-
251
-
252
-
253
-
254
-
255
-
256
-
257
-
258
-
259
-
260
-
261
-
262
-
263
-
264
-
265
-
266
-
267
-
268
-
269
-
270
-
271
-
272
-
273
-
274
-
275
-
276
-
277
-
278
-
279
-
280
-
281
-
282
-
283
-
284
-
285
-
286
-
287
-
288
-
289
-
290
-
291
-
292
-
293
-
294
-
295
-
296
-
297
-
298
-
299
-
300
-
301
-
302
-
303
-
304
-
305
-
306
-
307
-
308
-
309
-
310
-
311
-
312
-
313
-
314
-
315
-
316
-
317
-
318
-
319
-
320
-
321
-
322
-
323
-
324
-
325
-
326
-
327
-
328
-
329
-
330
-
331
-
332
-
333
-
334
-
335
-
336
-
337
-
338
-
339
-
340
-
341
-
342
-
343
-
344
-
345
-
346
-
347
-
348
-
349
-
350
-
351
-
352
-
353
-
354
-
355
-
356
-
357
-
358
-
359
-
360
-
361
-
362
-
363
-
364
-
365
-
366
-
367
-
368
-
369
-
370
-
371
-
372
-
373
-
374
-
375
-
376
-
377
-
378
-
379
-
380
-
381
-
382
-
383
-
384
-
385
-
386
-
387
-
388
-
389
-
390
-
391
-
392
-
393
-
394
-
395
-
396
 |
 |

HSBC HOLDINGS PLC
Report of the Directors: Operating and Financial Review (continued)
Financial summary > Group performance
26
instances, eliminating the use of higher risk, non-
branch sales channels, and continued investment in
our collections infrastructure. In our CMB portfolios,
loan impairment charges and other credit risk
provisions declined by 50% to US$293m, as
improved economic conditions and credit quality
resulted in lower specific impairment charges in all
sectors.
In the Middle East, loan impairment charges
and other credit risk provisions fell by 53% to
US$627m as lower loan impairment charges in both
PFS and CMB were partly offset by an increase in
GB&M following restructuring activities. In our
PFS business, loan impairment charges declined
by 61% to US$227m, reflecting a marked decline
in delinquency levels and lower lending balances,
particularly in our credit card and unsecured
personal lending book, as a result of managing down
higher risk portfolios. Credit limits were tightened
and our customer acquisition strategy was revised in
the region to concentrate on Premier and Advance
customers. This resulted in an improvement in credit
quality. In CMB, lower loan impairment charges
reflected a reduction in collective impairment
charges and fewer specific loan impairment charges
as economic conditions improved.
In Rest of Asia-Pacific, loan impairment
charges declined as the credit environment
improved. In India, loan impairment charges fell by
83% to US$82m, mainly in PFS as certain unsecured
lending portfolios and the higher risk elements of the
credit card portfolio were managed down, and
economic conditions improved. Impairment charges
also declined in CMB, due to the non-recurrence of
charges against specific technology-related
exposures in 2009. Partly offsetting these increases
were higher specific loan impairment charges in
GB&M.
In Hong Kong, loan impairment charges fell by
77% to US$114m, as economic conditions improved
and fewer large specific loan impairment charges
were reported against the CMB and GB&M
portfolios. Loan impairment charges fell in PFS too,
mainly on unsecured lending as unemployment and
bankruptcy levels reduced.
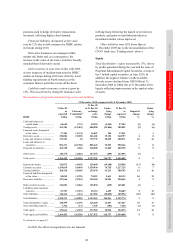
Operating expenses
2010 2009 2008
US$m US$m US$m
By expense category
Employee compensation and benefits ........................................................................ 19,836 18,468 20,792
Premises and equipment (excluding depreciation and impairment) .......................... 4,348 4,099 4,305
General and administrative expenses ......................................................................... 10,808 9,293 10,955
Administrative expenses ............................................................................................. 34,992 31,860 36,052
Depreciation and impairment of property, plant and equipment ............................... 1,713 1,725 1,750
Amortisation and impairment of intangible assets ..................................................... 983 810 733
Goodwill impairment .................................................................................................. – – 10,564
Operating expenses ..................................................................................................... 37,688 34,395 49,099
Staff numbers (full time equivalents)
At 31 December
2010 2009 2008
Europe ......................................................................................................................... 75,698 76,703 82,093
Hong Kong ................................................................................................................. 29,171 27,614 29,330
Rest of Asia-Pacific .................................................................................................... 91,607 87,141 89,706
Middle East ................................................................................................................. 8,676 8,281 8,453
North America ............................................................................................................ 33,865 35,458 44,725
Latin America ............................................................................................................. 56,044 54,288 58,559
Staff numbers .............................................................................................................. 295,061 289,485 312,866
Operating expenses increased by 10% to US$37.7bn
on a reported basis and by 8% on an underlying
basis. Significant one-off items included aggregate
payroll taxes of US$324m levied on 2009 bonuses in
the UK and France, and the curtailment of certain
benefits delivered through pension schemes, which
generated accounting credits of US$148m in the US
and US$480m (US$499m as reported) in the UK in
2010 and 2009, respectively. Excluding these items,
expenses grew by 6% as we continued to invest in
our operational infrastructure, customer-facing and
support staff, and GB&M’s capabilities and
platforms.
Employee compensation and benefits increased
by 7%, partly due to the net effect of the curtailment
gains and the payroll tax referred to above.