HSBC 2010 Annual Report Download - page 303
Download and view the complete annual report
Please find page 303 of the 2010 HSBC annual report below. You can navigate through the pages in the report by either clicking on the pages listed below, or by using the keyword search tool below to find specific information within the annual report.-
 1
1 -
2
-
3
-
4
-
5
-
6
-
7
-
8
-
9
-
10
-
11
-
12
-
13
-
14
-
15
-
16
-
17
-
18
-
19
-
20
-
21
-
22
-
23
-
24
-
25
-
26
-
27
-
28
-
29
-
30
-
31
-
32
-
33
-
34
-
35
-
36
-
37
-
38
-
39
-
40
-
41
-
42
-
43
-
44
-
45
-
46
-
47
-
48
-
49
-
50
-
51
-
52
-
53
-
54
-
55
-
56
-
57
-
58
-
59
-
60
-
61
-
62
-
63
-
64
-
65
-
66
-
67
-
68
-
69
-
70
-
71
-
72
-
73
-
74
-
75
-
76
-
77
-
78
-
79
-
80
-
81
-
82
-
83
-
84
-
85
-
86
-
87
-
88
-
89
-
90
-
91
-
92
-
93
-
94
-
95
-
96
-
97
-
98
-
99
-
100
-
101
-
102
-
103
-
104
-
105
-
106
-
107
-
108
-
109
-
110
-
111
-
112
-
113
-
114
-
115
-
116
-
117
-
118
-
119
-
120
-
121
-
122
-
123
-
124
-
125
-
126
-
127
-
128
-
129
-
130
-
131
-
132
-
133
-
134
-
135
-
136
-
137
-
138
-
139
-
140
-
141
-
142
-
143
-
144
-
145
-
146
-
147
-
148
-
149
-
150
-
151
-
152
-
153
-
154
-
155
-
156
-
157
-
158
-
159
-
160
-
161
-
162
-
163
-
164
-
165
-
166
-
167
-
168
-
169
-
170
-
171
-
172
-
173
-
174
-
175
-
176
-
177
-
178
-
179
-
180
-
181
-
182
-
183
-
184
-
185
-
186
-
187
-
188
-
189
-
190
-
191
-
192
-
193
-
194
-
195
-
196
-
197
-
198
-
199
-
200
-
201
-
202
-
203
-
204
-
205
-
206
-
207
-
208
-
209
-
210
-
211
-
212
-
213
-
214
-
215
-
216
-
217
-
218
-
219
-
220
-
221
-
222
-
223
-
224
-
225
-
226
-
227
-
228
-
229
-
230
-
231
-
232
-
233
-
234
-
235
-
236
-
237
-
238
-
239
-
240
-
241
-
242
-
243
-
244
-
245
-
246
-
247
-
248
-
249
-
250
-
251
-
252
-
253
-
254
-
255
-
256
-
257
-
258
-
259
-
260
-
261
-
262
-
263
-
264
-
265
-
266
-
267
-
268
-
269
-
270
-
271
-
272
-
273
-
274
-
275
-
276
-
277
-
278
-
279
-
280
-
281
-
282
-
283
-
284
-
285
-
286
-
287
-
288
-
289
-
290
-
291
-
292
-
 293
293 -
 294
294 -
 295
295 -
 296
296 -
 297
297 -
 298
298 -
 299
299 -
 300
300 -
 301
301 -
 302
302 -
 303
303 -
 304
304 -
 305
305 -
 306
306 -
 307
307 -
 308
308 -
 309
309 -
 310
310 -
 311
311 -
 312
312 -
 313
313 -
314
-
315
-
316
-
317
-
318
-
319
-
320
-
321
-
322
-
323
-
324
-
325
-
326
-
327
-
328
-
329
-
330
-
331
-
332
-
333
-
334
-
335
-
336
-
337
-
338
-
339
-
340
-
341
-
342
-
343
-
344
-
345
-
346
-
347
-
348
-
349
-
350
-
351
-
352
-
353
-
354
-
355
-
356
-
357
-
358
-
359
-
360
-
361
-
362
-
363
-
364
-
365
-
366
-
367
-
368
-
369
-
370
-
371
-
372
-
373
-
374
-
375
-
376
-
377
-
378
-
379
-
380
-
381
-
382
-
383
-
384
-
385
-
386
-
387
-
388
-
389
-
390
-
391
-
392
-
393
-
394
-
395
-
396
 |
 |

301
Overview Operating & Financial Review Governance Financial Statements Shareholder Information
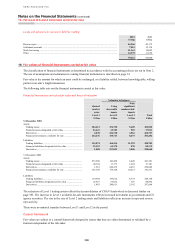
Other information about the profit/(loss) for the year
Europe
Hong
Kong
Rest of
Asia-
Pacific
Middle
East
North
America
Latin
America
Intra-
HSBC
items
Total
US$m US$m US$m US$m US$m US$m US$m US$m
2010
Net operating income .................. 19,730 10,088 8,793 1,783 8,752 8,187 (3,125) 54,208
External .................................. 18,881 9,170 7,728 1,774 8,504 8,151 – 54,208
Inter-segment .......................... 849 918 1,065 9 248 36 (3,125) –
Profit/(loss) for the year includes
the following significant non-
cash items:
Depreciation, amortisation
and impairment ................... 1,071 404 243 49 471 458 – 2,696
Loan impairment losses gross
of recoveries and other
credit risk provisions .......... 3,303 169 615 684 8,476 1,812 – 15,059
Impairment of financial
investments ......................... 35 41 4 5 21 1 – 107
2009
Net operating income .................. 17,976 8,967 7,107 1,260 641 6,498 (2,756) 39,693
External .................................. 16,734 8,352 6,056 1,283 767 6,501 – 39,693
Inter-segment .......................... 1,242 615 1,051 (23) (126) (3) (2,756) –
Profit/(loss) for the year includes
the following significant non-
cash items:
Depreciation, amortisation
and impairment ................... 1,039 342 215 37 515 390 – 2,538
Loan impairment losses gross
of recoveries and other
credit risk provisions .......... 5,833 534 1,028 1,361 15,757 2,865 – 27,378
Impairment of financial
investments ......................... 137 129 50 4 38 – – 358
2008
Net operating income .................. 26,925 9,389 8,129 2,389 4,384 8,021 (2,492) 56,745
External .................................. 25,887 8,205 7,010 2,386 5,236 8,021 – 56,745
Inter-segment .......................... 1,038 1,184 1,119 3 (852) – (2,492) –
Profit/(loss) for the year includes
the following significant non-
cash items:
Depreciation, amortisation
and impairment ................... 1,093 312 192 31 11,352 387 – 13,367
Loan impairment losses gross
of recoveries and other
credit risk provisions .......... 4,050 803 960 309 16,892 2,757 – 25,771
Impairment of financial
investments ......................... 278 535 – – 229 – – 1,042