HSBC 2010 Annual Report Download - page 32
Download and view the complete annual report
Please find page 32 of the 2010 HSBC annual report below. You can navigate through the pages in the report by either clicking on the pages listed below, or by using the keyword search tool below to find specific information within the annual report.-
 1
1 -
2
-
3
-
4
-
5
-
6
-
7
-
8
-
9
-
10
-
11
-
12
-
13
-
14
-
15
-
16
-
17
-
18
-
19
-
20
-
21
-
 22
22 -
 23
23 -
 24
24 -
 25
25 -
 26
26 -
 27
27 -
 28
28 -
 29
29 -
 30
30 -
 31
31 -
 32
32 -
 33
33 -
 34
34 -
 35
35 -
 36
36 -
 37
37 -
 38
38 -
 39
39 -
 40
40 -
 41
41 -
 42
42 -
43
-
44
-
45
-
46
-
47
-
48
-
49
-
50
-
51
-
52
-
53
-
54
-
55
-
56
-
57
-
58
-
59
-
60
-
61
-
62
-
63
-
64
-
65
-
66
-
67
-
68
-
69
-
70
-
71
-
72
-
73
-
74
-
75
-
76
-
77
-
78
-
79
-
80
-
81
-
82
-
83
-
84
-
85
-
86
-
87
-
88
-
89
-
90
-
91
-
92
-
93
-
94
-
95
-
96
-
97
-
98
-
99
-
100
-
101
-
102
-
103
-
104
-
105
-
106
-
107
-
108
-
109
-
110
-
111
-
112
-
113
-
114
-
115
-
116
-
117
-
118
-
119
-
120
-
121
-
122
-
123
-
124
-
125
-
126
-
127
-
128
-
129
-
130
-
131
-
132
-
133
-
134
-
135
-
136
-
137
-
138
-
139
-
140
-
141
-
142
-
143
-
144
-
145
-
146
-
147
-
148
-
149
-
150
-
151
-
152
-
153
-
154
-
155
-
156
-
157
-
158
-
159
-
160
-
161
-
162
-
163
-
164
-
165
-
166
-
167
-
168
-
169
-
170
-
171
-
172
-
173
-
174
-
175
-
176
-
177
-
178
-
179
-
180
-
181
-
182
-
183
-
184
-
185
-
186
-
187
-
188
-
189
-
190
-
191
-
192
-
193
-
194
-
195
-
196
-
197
-
198
-
199
-
200
-
201
-
202
-
203
-
204
-
205
-
206
-
207
-
208
-
209
-
210
-
211
-
212
-
213
-
214
-
215
-
216
-
217
-
218
-
219
-
220
-
221
-
222
-
223
-
224
-
225
-
226
-
227
-
228
-
229
-
230
-
231
-
232
-
233
-
234
-
235
-
236
-
237
-
238
-
239
-
240
-
241
-
242
-
243
-
244
-
245
-
246
-
247
-
248
-
249
-
250
-
251
-
252
-
253
-
254
-
255
-
256
-
257
-
258
-
259
-
260
-
261
-
262
-
263
-
264
-
265
-
266
-
267
-
268
-
269
-
270
-
271
-
272
-
273
-
274
-
275
-
276
-
277
-
278
-
279
-
280
-
281
-
282
-
283
-
284
-
285
-
286
-
287
-
288
-
289
-
290
-
291
-
292
-
293
-
294
-
295
-
296
-
297
-
298
-
299
-
300
-
301
-
302
-
303
-
304
-
305
-
306
-
307
-
308
-
309
-
310
-
311
-
312
-
313
-
314
-
315
-
316
-
317
-
318
-
319
-
320
-
321
-
322
-
323
-
324
-
325
-
326
-
327
-
328
-
329
-
330
-
331
-
332
-
333
-
334
-
335
-
336
-
337
-
338
-
339
-
340
-
341
-
342
-
343
-
344
-
345
-
346
-
347
-
348
-
349
-
350
-
351
-
352
-
353
-
354
-
355
-
356
-
357
-
358
-
359
-
360
-
361
-
362
-
363
-
364
-
365
-
366
-
367
-
368
-
369
-
370
-
371
-
372
-
373
-
374
-
375
-
376
-
377
-
378
-
379
-
380
-
381
-
382
-
383
-
384
-
385
-
386
-
387
-
388
-
389
-
390
-
391
-
392
-
393
-
394
-
395
-
396
 |
 |

HSBC HOLDINGS PLC
Report of the Directors: Operating and Financial Review (continued)
Financial summary > Balance sheet
30
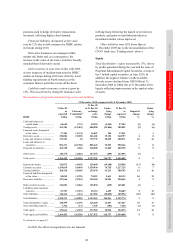
Movement in 2010
Total assets amounted to US$2.5 trillion, 4% higher
than at 31 December 2009. Excluding the effect
of currency movements, underlying total assets
increased by 5%. This reflected higher mortgage
lending in Hong Kong and the UK, strong demand
for commercial loans and a rise in trading assets in
North America and Asia as a result of customer
demand, supported by improved liquidity generated
by higher deposits and our debt issuance programme.
The Group’s reported tier 1 ratio increased from
10.8% to 12.1% due to the contribution from profits
attributable to shareholders for the year net of
dividends paid, the issue of hybrid capital securities
net of redemptions, and a reduction in the reported
level of risk-weighted assets (‘RWA’s). The latter
was driven by a decline in some retail portfolio
exposures in North America as a result of run-off,
partly offset by the effect of lending growth in Asia.
Market risk RWAs decreased as a result of reduced
volatility and continuing exposure management. For
more details of capital and RWAs, see page 177.
The following commentary is on an underlying
basis.
Assets
Cash and balances at central banks decreased by 4%
as a result of lower year-end cash balances in North
America as excess liquidity was redeployed into
highly-rated government debt securities. This was
partly offset by higher year-end cash balances in
Europe.
Trading assets fell by 6%, due to the
deconsolidation of the Constant Net Asset Value
(‘CNAV’) funds totalling US$44bn (see Note 43 on
the Financial Statements). This was offset, in part,
by higher issuance of and customer demand for
government and government agency debt securities,
particularly in North America and Asia, and an
increase in holdings of equities to hedge derivative
positions arising from a rise in client trading activity.
Higher customer-driven trading volumes also
resulted in an increase in reverse repo balances in
North America; this was partly offset by a reduction
in reverse repo balances in Europe due to market
uncertainty.
Strong increase in loans and advances to
customers and customer accounts, notably
in Asia, drove balance sheet growth.
Financial assets designated at fair value grew
by 3% due to an increase in volumes in equity funds
and a rise in the fair value of equity securities held
within the insurance business, particularly in Europe
and Hong Kong, as market values recovered and
client risk appetite returned. This was partly offset
by the sale of European government debt securities
by Balance Sheet Management.
Derivative assets rose by 8%. This was
driven by increases in the fair value of interest rate
contracts as a result of downward shifts of major
yield curves, offset by higher netting from increased
trading with clearing houses. The notional value of
outstanding contracts also rose, reflecting an
increase in the number of open transactions
compared with 2009.
Loans and advances to banks increased by 16%
due to higher placements with commercial and
central banks in Europe and Latin America.
Loans and advances to customers grew by
8% as we targeted commercial loans and, in the
improved economic conditions, demand grew from
customers, notably in Asia. The increase in demand
for credit, along with competitive pricing, also drove
continued growth in mortgage lending in Hong Kong
and the UK, though mortgage balances declined in
North America as the Consumer Lending and
Mortgage Services portfolios continued to run off
and credit card lending fell.
Financial investments rose by 9%, mainly in
North America and Europe, as Balance Sheet
Management redeployed cash into available-for-sale
treasury bills and government agency debt securities.
This was partly offset by a decline in financial
investments in Asia, as a result of disposals and debt
securities that matured and were not replaced to
support growth in commercial lending.
Liabilities
Deposits by banks decreased by 8%, reflecting a
notable decline in central bank deposits in Europe
which was partly offset by an increase in central
bank deposits in Asia.
Customer accounts were 7% higher, driven by
an overall increase in savings and current accounts
across most regions, particularly in Asia and Europe.
Growth in Premier and online savings contributed to
a significant increase in current account balances as
customers responded well to targeted promotional
campaigns.
Trading liabilities increased by 16%. Higher
repo balances in North America were reported as a
result of increased trading volumes of treasury and
corporate bonds driven by market volatility in the
bond market. In Europe, short bond and equity