HSBC 2010 Annual Report Download - page 33
Download and view the complete annual report
Please find page 33 of the 2010 HSBC annual report below. You can navigate through the pages in the report by either clicking on the pages listed below, or by using the keyword search tool below to find specific information within the annual report.-
 1
1 -
2
-
3
-
4
-
5
-
6
-
7
-
8
-
9
-
10
-
11
-
12
-
13
-
14
-
15
-
16
-
17
-
18
-
19
-
20
-
21
-
22
-
 23
23 -
 24
24 -
 25
25 -
 26
26 -
 27
27 -
 28
28 -
 29
29 -
 30
30 -
 31
31 -
 32
32 -
 33
33 -
 34
34 -
 35
35 -
 36
36 -
 37
37 -
 38
38 -
 39
39 -
 40
40 -
 41
41 -
 42
42 -
 43
43 -
44
-
45
-
46
-
47
-
48
-
49
-
50
-
51
-
52
-
53
-
54
-
55
-
56
-
57
-
58
-
59
-
60
-
61
-
62
-
63
-
64
-
65
-
66
-
67
-
68
-
69
-
70
-
71
-
72
-
73
-
74
-
75
-
76
-
77
-
78
-
79
-
80
-
81
-
82
-
83
-
84
-
85
-
86
-
87
-
88
-
89
-
90
-
91
-
92
-
93
-
94
-
95
-
96
-
97
-
98
-
99
-
100
-
101
-
102
-
103
-
104
-
105
-
106
-
107
-
108
-
109
-
110
-
111
-
112
-
113
-
114
-
115
-
116
-
117
-
118
-
119
-
120
-
121
-
122
-
123
-
124
-
125
-
126
-
127
-
128
-
129
-
130
-
131
-
132
-
133
-
134
-
135
-
136
-
137
-
138
-
139
-
140
-
141
-
142
-
143
-
144
-
145
-
146
-
147
-
148
-
149
-
150
-
151
-
152
-
153
-
154
-
155
-
156
-
157
-
158
-
159
-
160
-
161
-
162
-
163
-
164
-
165
-
166
-
167
-
168
-
169
-
170
-
171
-
172
-
173
-
174
-
175
-
176
-
177
-
178
-
179
-
180
-
181
-
182
-
183
-
184
-
185
-
186
-
187
-
188
-
189
-
190
-
191
-
192
-
193
-
194
-
195
-
196
-
197
-
198
-
199
-
200
-
201
-
202
-
203
-
204
-
205
-
206
-
207
-
208
-
209
-
210
-
211
-
212
-
213
-
214
-
215
-
216
-
217
-
218
-
219
-
220
-
221
-
222
-
223
-
224
-
225
-
226
-
227
-
228
-
229
-
230
-
231
-
232
-
233
-
234
-
235
-
236
-
237
-
238
-
239
-
240
-
241
-
242
-
243
-
244
-
245
-
246
-
247
-
248
-
249
-
250
-
251
-
252
-
253
-
254
-
255
-
256
-
257
-
258
-
259
-
260
-
261
-
262
-
263
-
264
-
265
-
266
-
267
-
268
-
269
-
270
-
271
-
272
-
273
-
274
-
275
-
276
-
277
-
278
-
279
-
280
-
281
-
282
-
283
-
284
-
285
-
286
-
287
-
288
-
289
-
290
-
291
-
292
-
293
-
294
-
295
-
296
-
297
-
298
-
299
-
300
-
301
-
302
-
303
-
304
-
305
-
306
-
307
-
308
-
309
-
310
-
311
-
312
-
313
-
314
-
315
-
316
-
317
-
318
-
319
-
320
-
321
-
322
-
323
-
324
-
325
-
326
-
327
-
328
-
329
-
330
-
331
-
332
-
333
-
334
-
335
-
336
-
337
-
338
-
339
-
340
-
341
-
342
-
343
-
344
-
345
-
346
-
347
-
348
-
349
-
350
-
351
-
352
-
353
-
354
-
355
-
356
-
357
-
358
-
359
-
360
-
361
-
362
-
363
-
364
-
365
-
366
-
367
-
368
-
369
-
370
-
371
-
372
-
373
-
374
-
375
-
376
-
377
-
378
-
379
-
380
-
381
-
382
-
383
-
384
-
385
-
386
-
387
-
388
-
389
-
390
-
391
-
392
-
393
-
394
-
395
-
396
 |
 |

31
Overview Operating & Financial Review Governance Financial Statements Shareholder Information
positions used to hedge derivative transactions
increased, reflecting higher client demand.
Financial liabilities designated at fair value
rose by 12% due to debt issuances by HSBC entities
in Europe during 2010.
Derivative businesses are managed within
market risk limits and, as a consequence, the
increase in the value of derivative liabilities broadly
matched that of derivative assets.
Debt securities in issue were in line with 2009,
as new issuances of medium-term notes by HSBC
entities in Europe during 2010 were offset by lower
funding requirements in North America as the
consumer finance portfolios in run-off declined.
Liabilities under insurance contracts grew by
12%. This was driven by strong life insurance sales
in Hong Kong following the launch of several new
products, and gains on unit-linked products as
investment market values improved.
Other liabilities were 26% lower than at
31 December 2009 due to the deconsolidation of the
CNAV funds (see ‘Trading assets’ above).
Equity
Total shareholders’ equity increased by 17%, driven
by profits generated during the year and the issue of
Perpetual Subordinated Capital Securities, a form of
tier 1 hybrid capital securities, in June 2010. In
addition, the negative balance on the available-
for-sale reserve declined from US$10.0bn at 31
December 2009 to US$4.1bn at 31 December 2010,
largely reflecting improvements in the market value
of assets.
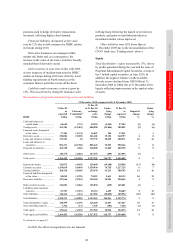
Reconciliation of reported and underlying assets and liabilities
31 December 2010 compared with 31 December 2009
31 Dec 09
as
reported
Currency
Translation40
31 Dec 09
at 31 Dec 10
exchange
rates
Under-
lying
change
31 Dec 10
as
reported
Reported
change
Under-
lying
change
HSBC US$m US$m US$m US$m US$m % %
Cash and balances at
central banks .......................... 60,655 (731) 59,924 (2,541) 57,383
(5) (4)
Trading assets ............................ 421,381 (12,483) 408,898 (23,846) 385,052 (9) (6)
Financial assets designated
at fair value ............................ 37,181 (1,134) 36,047 964 37,011
– 3
Derivative assets ........................ 250,886 (9,285) 241,601 19,156 260,757 4 8
Loans and advances to banks .... 179,781 (5) 179,776 28,495 208,271 16 16
Loans and advances to
customers ............................... 896,231 (10,788) 885,443 72,923 958,366 7 8
Financial investments ................ 369,158 (268) 368,890 31,865 400,755 9 9
Other assets ................................ 149,179 (1,826) 147,353 (259) 147,094 (1)
–
Total assets ................................ 2,364,452 (36,520) 2,327,932 126,757 2,454,689 4 5
Deposits by banks ...................... 124,872 (4,182) 120,690 (10,106) 110,584 (11) (8)
Customer accounts ..................... 1,159,034 (8,064) 1,150,970 76,755 1,227,725 6 7
Trading liabilities ....................... 268,130 (8,660) 259,470 41,233 300,703 12 16
Financial liabilities designated
at fair value ............................ 80,092 (1,570) 78,522 9,611 88,133 10 12
Derivative liabilities .................. 247,646 (9,262) 238,384 20,281 258,665 4 9
Debt securities in issue .............. 146,896 (1,066) 145,830 (429) 145,401 (1)
–
Liabilities under insurance
contracts ................................. 53,707 (1,593) 52,114 6,495 58,609 9 12
Other liabilities .......................... 148,414 (431) 147,983 (38,029) 109,954 (26) (26)
Total liabilities ........................... 2,228,791 (34,828) 2,193,963 105,811 2,299,774 3 5
Total shareholders’ equity ......... 128,299 (1,679) 126,620 21,047 147,667 15 17
Non-controlling interests ........... 7,362 (13) 7,349 (101) 7,248 (2) (1)
Total equity ................................ 135,661 (1,692) 133,969 20,946 154,915 14 16
Total equity and liabilities ......... 2,364,452 (36,520) 2,327,932 126,757 2,454,689 4 5
For footnote, see page 83.
In 2010, the effect of acquisitions was not material.