Lowe's 2000 Annual Report Download - page 21
Download and view the complete annual report
Please find page 21 of the 2000 Lowe's annual report below. You can navigate through the pages in the report by either clicking on the pages listed below, or by using the keyword search tool below to find specific information within the annual report.-
 1
1 -
2
-
3
-
4
-
5
-
6
-
7
-
8
-
9
-
10
-
 11
11 -
 12
12 -
 13
13 -
 14
14 -
 15
15 -
 16
16 -
 17
17 -
 18
18 -
 19
19 -
 20
20 -
 21
21 -
 22
22 -
 23
23 -
 24
24 -
 25
25 -
 26
26 -
 27
27 -
 28
28 -
 29
29 -
 30
30 -
 31
31 -
32
-
33
-
34
-
35
-
36
-
37
-
38
-
39
-
40
-
41
-
42
-
43
-
44
 |
 |

Lowe’s Companies, Inc.
19
This discussion summarizes the significant factors affecting the
Company’s consolidated operating results, liquidity and capital
resources during the three-year period ended February 2, 2001
(i.e., fiscal years 2000, 1999 and 1998). Fiscal year 2000 includes
53 weeks of sales and expenses while fiscal years 1999 and 1998
include 52 weeks of sales and expenses. This discussion should be
read in conjunction with the financial statements and financial
statement footnotes included in this annual report.
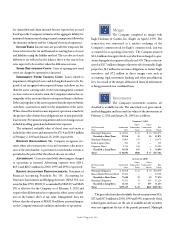
The Company completed its merger with Eagle Hardware &
Garden, Inc. (Eagle) on April 2, 1999. The transaction, which was
valued at approximately $1.3billion, was structured as a tax-free
exchange of the Company’s common stock for Eagle’s common
stock, and was accounted for as a pooling of interests. As a result, all
historical financial information is presented on a combined basis.
Operations
Net earnings for 2000 increased 20% to $809.9million or 4.3%
of sales compared to $672.8million or 4.2% of sales for 1999. Net
earnings for 1999 increased 34% to $672.8million or 4.2% of sales
compared to $500.4million or 3.8% of sales for 1998. Diluted
earnings per share were $2.11 for 2000 compared to $1.75 for 1999
and $1.34 for 1998. Return on beginning assets was 9.0% for 2000
compared to 9.5% for 1999; and return on beginning shareholders’
equity was 17.2% for 2000 compared to 18.6% for 1999. Prior year
results include a one-time charge of $.04 per share for costs related
to the merger with Eagle on April 2, 1999. Diluted earnings per
share increased 18% and net earnings increased 17% over 1999
excluding the one-time charge for the merger.
The Company’s sales were $18.8billion in 2000, an 18%
increase over 1999 sales of $15.9billion. Sales for 1999 were 19%
higher than 1998 levels. Comparable store sales increased 1.2% in
2000. The increases in sales are attributable to the Company’s
ongoing store expansion and relocation program. Sales at the
Company’s comparable stores were impacted by several factors
during 2000 including the remerchandising of former Eagle
stores and deflation in lumber and building material prices, which
produced a negative 170 and 150 basis point impact, respectively.
In addition, the Company’s 1999 decision to replace highly cycli-
cal, low margin consumer electronics with higher margin, small
appliances had a negative 40 basis point impact on comparable
store sales but a favorable impact on gross margin dollars. During
the year, the Company experienced its strongest sales increases in
appliances, flooring, and cabinets. The following table presents
sales and store information:
2000 1999 1998
Sales (in millions)
$18,779 $15,906 $13,331
Sales Increases
18% 19% 20%
Comparable Store Sales Increases
1% 6% 6%
At end of year:
Stores
650 576 520
Sales Floor Square Feet (in millions)
67.8 57.0 47.8
Average Store Size Square Feet (in thousands)
104 99 92
Gross margin in 2000 was 28.2% of sales compared to 27.5%
in 1999. Both of these years showed improvement over the
26.8% rate achieved in 1998. Continued progress in product line
reviews and better buying provided margin improvements net of
an approximate 10 basis point impact from a company-wide 10%
off promotion during December 2000.
Selling, general and administrative expenses (SG&A) were
$3.3billion or 17.8% of sales in 2000. SG&A in the two previous
years were $2.8and $2.3billion or 17.4% and 17.5% of sales,
respectively. During 2000, SG&A increased 21% compared to
the 18% increase in sales. The increase in SG&A compared to the
sales increase is primarily attributable to an increase in store
salaries combined with lower than expected sales levels.
Store opening costs, which were expensed as incurred, were
$131.8million for 2000 compared to $98.4and $75.6million in
1999 and 1998, respectively. These costs are associated with the
opening of 100 stores in 2000 (80 new and 20 relocated). This
compares to 91 stores in 1999 (60 new and 31 relocated) and 81
stores in 1998 (50 new and 31 relocated). As a percentage of sales,
store opening costs were 0.7% for 2000 and 0.6% in both 1999
and 1998. Store opening costs averaged approximately $1.1mil-
lion per store in 2000.
Depreciation, reflecting continued fixed asset expansion,
increased 21% to $408.6million in 2000, compared to increases
of 17% and 13% in 1999 and 1998, respectively. Depreciation as a
percentage of sales was 2.2% for 2000, a slight increase from 2.1%
in 1999 and flat with 1998. Approximately 25% of new stores
opened in the last three years have been leased, of which approxi-
mately 30% were under capital leases. Property less accumulated
depreciation increased to $7.0billion at February 2, 2001 compared
Management’s Discussion and Analysis of
Financial Condition and Results of Operations