Lowe's 2000 Annual Report Download - page 39
Download and view the complete annual report
Please find page 39 of the 2000 Lowe's annual report below. You can navigate through the pages in the report by either clicking on the pages listed below, or by using the keyword search tool below to find specific information within the annual report.-
 1
1 -
2
-
3
-
4
-
5
-
6
-
7
-
8
-
9
-
10
-
11
-
12
-
13
-
14
-
15
-
16
-
17
-
18
-
19
-
20
-
21
-
22
-
23
-
24
-
25
-
26
-
27
-
28
-
 29
29 -
 30
30 -
 31
31 -
 32
32 -
 33
33 -
 34
34 -
 35
35 -
 36
36 -
 37
37 -
 38
38 -
 39
39 -
 40
40 -
 41
41 -
 42
42 -
 43
43 -
 44
44
 |
 |

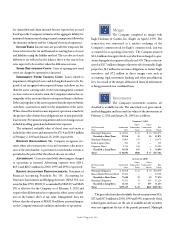
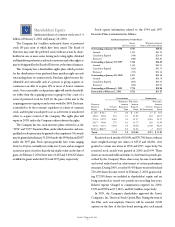
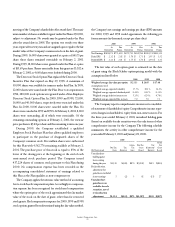
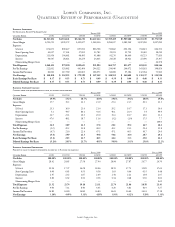
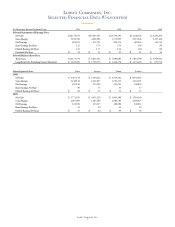
Lowe’s Companies, Inc.
37
(In Thousands, Except Per Share Data) 2000 1999 1998 1997 1996
Selected Statements of Earnings Data:
Net Sales
$18,778,559 $ 15,905,595 $ 13,330,540 $ 11,108,378 $ 9,361,204
Gross Margin
5,290,768 4,380,582 3,573,895 2,953,046 2,437,414
Net Earnings
809,871 672,795 500,374 383,030 314,730
Basic Earnings Per Share
2.12 1.76 1.35 1.04 .90
Diluted Earnings Per Share
2.11 1.75 1.34 1.04 .88
Dividends Per Share
$ .14 $ .13 $ .12 $ .11 $ .10
Selected Balance Sheet Data:
Total Assets
$11,375,754 $ 9,012,323 $ 7,086,882 $ 5,861,790 $ 4,999,566
Long-Term Debt, Excluding Current Maturities
$ 2,697,669 $ 1,726,579 $ 1,364,278 $ 1,191,406 $ 875,754
Selected Quarterly Data: First Second Third Fourth
2000
Net Sales
$ 4,467,114 $ 5,264,252 $ 4,504,141 $ 4,543,052
Gross Margin
1,248,116 1,452,027 1,299,372 1,291,253
Net Earnings
187,149 279,599 202,293 140,830
Basic Earnings Per Share
.49 .73 .53 .37
Diluted Earnings Per Share
$ .49 $ .73 $ .53 $ .37
1999
Net Sales
$ 3,771,919 $ 4,435,219 $ 3,909,188 $ 3,789,269
Gross Margin
1,007,090 1,187,286 1,089,549 1,096,657
Net Earnings
124,958 230,217 168,688 148,932
Basic Earnings Per Share
.33 .60 .44 .39
Diluted Earnings Per Share
$ .33 $ .60 $ .44 $ .39
Lowe’s Companies, Inc.
Selected Financial Data (Unaudited)