Lowe's 2000 Annual Report Download - page 33
Download and view the complete annual report
Please find page 33 of the 2000 Lowe's annual report below. You can navigate through the pages in the report by either clicking on the pages listed below, or by using the keyword search tool below to find specific information within the annual report.-
 1
1 -
2
-
3
-
4
-
5
-
6
-
7
-
8
-
9
-
10
-
11
-
12
-
13
-
14
-
15
-
16
-
17
-
18
-
19
-
20
-
21
-
22
-
 23
23 -
 24
24 -
 25
25 -
 26
26 -
 27
27 -
 28
28 -
 29
29 -
 30
30 -
 31
31 -
 32
32 -
 33
33 -
 34
34 -
 35
35 -
 36
36 -
 37
37 -
 38
38 -
 39
39 -
 40
40 -
 41
41 -
 42
42 -
 43
43 -
44
 |
 |

Lowe’s Companies, Inc.
31
meeting of the Company’s shareholders (the award date). The maxi-
mum number of shares available for grant under the Plan is 250,000,
subject to adjustment. No awards may be granted under the Plan
after the award date in 2008. The options vest evenly over three
years, expire after seven years and are assigned a price equal to the fair
market value of the Company’s common stock on the date of grant.
During 2000, 16,000 shares were granted at a price of $45.75 per
share; these shares remained exercisable on February 2, 2001.
During 1999, 18,000 shares were granted under the Plan at a price
of $51.69 per share. Shares exercisable from this grant are 13,332 at
February 2, 2001 as 4,668 shares were forfeited during 2000.
The Directors’ Stock Option Plan replaced the Directors’ Stock
Incentive Plan that expired on May 29, 1998. A maximum of
50,000 shares was available for issuance under this Plan. In 1998,
12,000 shares were issued under the Plan. Prior to its expiration in
1994, 280,000 stock options were granted under a Non-Employee
Directors’ Stock Option Plan. In 2000, 1999 and 1998, 72,000,
16,000 and 40,000 shares, respectively, were exercised under this
Plan. In 2000, 8,000 shares were canceled under the Plan. No
shares were canceled in 1999 and 1998. At February 2, 2001, 8,000
shares were outstanding, all of which were exercisable. Of the
remaining outstanding options at February 2, 2001, the exercise
price per share is $5.48 per share and the remaining term is one year.
During 2000, the Company established a qualified
Employee Stock Purchase Plan that allows qualified employees
to participate in the purchase of designated shares of the
Company’s common stock. Five million shares were authorized
for this Plan with 4,562,776 remaining available at February 2,
2001. The purchase price of this stock is equal to 85% of the
lower of the closing price at the beginning or the end of each
semi-annual stock purchase period. The Company issued
437,224 shares of common stock pursuant to this Plan during
2000. No compensation expense has been recorded in the
accompanying consolidated statement of earnings related to
this Plan as the Plan qualifies as non-compensatory.
The Company applies the intrinsic value method of accounting
for its stock-based compensation plans. Accordingly, no compensa-
tion expense has been recognized for stock-based compensation
where the option price of the stock approximated the fair market
value of the stock on the date of grant, other than for restricted
stock grants. Had compensation expense for 2000, 1999 and 1998
stock options granted been determined using the fair value method,
the Company’s net earnings and earnings per share (EPS) amounts
for 2000, 1999 and 1998 would approximate the following pro
forma amounts (in thousands, except per share data):
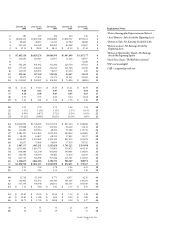
2000 1999 1998
As Pro As Pro As Pro
Reported Forma Reported Forma Reported Forma
Net Earnings
$809,871 $773,430 $672,795 $652,786 $500,374 $491,151
Basic EPS
$ 2.12 $ 2.02 $ 1.76 $ 1.71 $ 1.35 $ 1.32
Diluted EPS
$ 2.11 $ 2.01 $ 1.75 $ 1.70 $ 1.34 $ 1.32
The fair value of each option grant is estimated on the date
of grant using the Black-Scholes option-pricing model with the
assumptions listed below.
2000 1999 1998
Weighted average fair value per option
$ 23.13 $ 26.05 $ 17.48
Assumptions used:
Weighted average expected volatility
37.7% 38.1% 34.2%
Weighted average expected dividend yield
0.41% 0.52% 0.31%
Weighted average risk-free interest rate
5.15% 6.24% 4.78%
Weighted average expected life, in years
7.0 7.0 7.3
The Company reports comprehensive income in its consolidat-
ed statement of shareholders’ equity. Comprehensive income repre-
sents changes in shareholders’ equity from non-owner sources. For
the three years ended February 2, 2001, unrealized holding gains
(losses) on available-for-sale securities were the only items of other
comprehensive income for the Company. The following schedule
summarizes the activity in other comprehensive income for the
years ended February 2, 2001 and January 28, 2000:
2000 1999
After
After Pre-Tax Tax Tax
Pre-Tax Tax Tax Gain/ (Expense)/ Gain/
(In Thousands) Gain Expense Gain (Loss) Benefit (Loss)
Unrealized net
holding gains/
losses arising
during the year $1,319 $(445) $874 $(1,245) $435 $(810)
Reclassification
adjustment for
gains/losses included
in net earnings 5 (2) 3 42 (15) 27
Unrealized net
gains/losses on
available-for-sale
securities, net of
reclassification
adjustment $1,314 $(443) $871 $(1,287) $450 $(837)