Lowe's 2000 Annual Report Download - page 40
Download and view the complete annual report
Please find page 40 of the 2000 Lowe's annual report below. You can navigate through the pages in the report by either clicking on the pages listed below, or by using the keyword search tool below to find specific information within the annual report.-
 1
1 -
2
-
3
-
4
-
5
-
6
-
7
-
8
-
9
-
10
-
11
-
12
-
13
-
14
-
15
-
16
-
17
-
18
-
19
-
20
-
21
-
22
-
23
-
24
-
25
-
26
-
27
-
28
-
29
-
 30
30 -
 31
31 -
 32
32 -
 33
33 -
 34
34 -
 35
35 -
 36
36 -
 37
37 -
 38
38 -
 39
39 -
 40
40 -
 41
41 -
 42
42 -
 43
43 -
 44
44
 |
 |

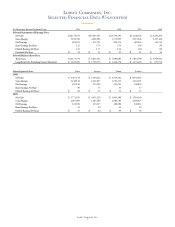
Lowe’s Companies, Inc.
38
5-year February 2, January 28, January 29, January 30, January 31,
Fiscal Years Ended On CGR 2001 2000 1999 1998 1997
Stores and People
1Number of Stores
10.8 650 576 520 477 429
2Square Footage
20.4 67,774,611 56,981,547 47,795,283 39,860,593 33,729,529
3Number of Employees
14.3 94,601 86,160 72,715 64,070 58,585
4Customer Transactions (In Thousands)
16.0 342,173 297,769 268,232 231,000 195,778
5Average Purchase
$ 54.88 $ 53.42 $ 49.70 $ 48.09 $ 47.82
Comparative Income Statements (In Thousands)
6Sales
19.5 $ 18,778,559 $ 15,905,595 $ 13,330,540 $ 11,108,378 $ 9,361,204
7Depreciation
20.7 408,618 337,359 288,607 255,694 209,612
8Store Restructuring
–– –– –– –– –– ––
9Operating Income (EBITDA)1
25.5 1,810,883 1,485,328 1,156,915 925,940 753,099
10 Pre-Tax Earnings
27.7 1,281,440 1,063,117 787,367 598,631 487,765
11 Income Tax Provision
NM 471,569 390,322 286,992 215,601 173,035
12 Net Earnings
27.3 809,871 672,795 500,374 383,030 314,730
13 Cash Dividends
11.9 53,479 47,558 41,171 38,239 34,709
14 Earnings Retained
NM $ 756,392 $ 625,237 $ 459,203 $ 344,791 $ 280,021
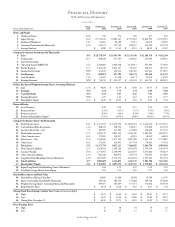
Dollars Per Share (Weighted Average Shares, Assuming Dilution)
15 Sales
17.8 $ 48.84 $ 41.44 $ 35.48 $ 29.97 $ 25.66
16 Earnings
25.4 2.11 1.75 1.34 1.04 0.88
17 Cash Dividends
10.4 0.14 0.13 0.12 0.11 0.10
18 Earnings Retained
NM 1.97 1.63 1.22 0.93 0.77
19 Shareholders’ Equity
22.4 $ 14.29 $ 12.23 $ 9.63 $ 8.03 $ 7.04
Financial Ratios
20 Asset Turnover2
2.08 2.24 2.27 2.22 2.36
21 Return on Sales3
4.31% 4.23% 3.75% 3.45% 3.36%
22 Return on Assets4
8.99% 9.49% 8.54% 7.66% 7.93%
23 Return on Shareholders’ Equity 5
17.25% 18.59% 16.80% 14.92% 16.95%
Comparative Balance Sheets (In Thousands)
24 Total Current Assets
18.3 $ 4,175,013 $ 3,693,156 $ 2,864,574 $ 2,426,636 $ 2,134,761
25 Cash and Short-Term Investments
21.4 468,529 568,792 249,217 274,858 122,558
26 Accounts Receivable—Net
7.2 160,985 147,901 143,928 118,408 117,562
27 Merchandise Inventory
17.2 3,285,370 2,812,361 2,384,700 1,985,041 1,854,795
28 Other Current Assets
36.1 179,085 110,957 44,915 38,659 46,824
29 Fixed Assets—Net
27.9 7,034,960 5,177,222 4,085,798 3,321,332 2,771,889
30 Other Assets
16.2 131,091 110,831 107,794 78,661 57,301
31 Total Assets
23.5 11,375,754 9,012,323 7,086,882 5,861,790 4,999,566
32 Total Current Liabilities
22.7 2,928,585 2,385,954 1,924,256 1,554,359 1,443,249
33 Accounts Payable
20.0 1,731,957 1,566,946 1,220,543 1,035,882 978,224
34 Other Current Liabilities
32.4 662,410 400,676 269,734 241,041 213,062
35 Long-Term Debt (Excluding Current Maturities)
22.8 2,697,669 1,726,579 1,364,278 1,191,406 875,754
36 Total Liabilities
22.7 5,880,869 4,316,852 3,467,115 2,883,786 2,432,020
37 Shareholders’ Equity
24.2 $ 5,494,885 $ 4,695,471 $ 3,619,767 $ 2,978,004 $ 2,567,546
38 Equity/Long-Term Debt (Excluding Current Maturities)
2.04 2.72 2.65 2.50 2.93
39 Year-End Leverage Factor: Assets/Equity
2.07 1.92 1.96 1.97 1.95
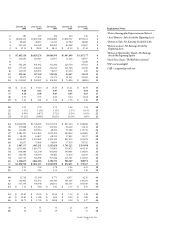
Shareholders, Shares and Book Value
40 Shareholders of Record, Year-End
16,885 15,446 14,508 12,386 12,530
41 Shares Outstanding, Year-End (In Thousands)
383,242 382,359 374,388 369,238 365,298
42 Weighted Average Shares, Assuming Dilution (In Thousands)
384,475 383,854 375,751 370,632 364,758
43 Book Value Per Share
$ 14.34 $ 12.28 $ 9.67 $ 8.07 $ 7.03
Closing Stock Price During Calendar Year6(Adjusted for Stock Splits)
44 High
$ 67.25 $ 66.44 $ 51.69 $ 24.47 $ 21.75
45 Low
$ 34.25 $ 43.00 $ 22.00 $ 15.82 $ 14.32
46 Closing Price December 31
$ 44.50 $ 59.75 $ 51.19 $ 23.85 $ 17.82
Price/Earnings Ratio
47 High
32 38 39 24 25
48 Low
16 25 17 15 17
Financial History
10 Year Financial Information