Lowe's 2000 Annual Report Download - page 4
Download and view the complete annual report
Please find page 4 of the 2000 Lowe's annual report below. You can navigate through the pages in the report by either clicking on the pages listed below, or by using the keyword search tool below to find specific information within the annual report.-
 1
1 -
 2
2 -
 3
3 -
 4
4 -
 5
5 -
 6
6 -
 7
7 -
 8
8 -
 9
9 -
 10
10 -
 11
11 -
 12
12 -
 13
13 -
 14
14 -
 15
15 -
16
-
17
-
18
-
19
-
20
-
21
-
22
-
23
-
24
-
25
-
26
-
27
-
28
-
29
-
30
-
31
-
32
-
33
-
34
-
35
-
36
-
37
-
38
-
39
-
40
-
41
-
42
-
43
-
44
 |
 |

Lowe’s Companies, Inc.
2
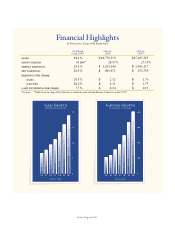
sales 18.1% $ 18,778,559 $15,905,595
gross margin 63 bps* 28.17% 27.54%
pretax earnings 20.5% $ 1,281,440 $ 1,063,117
net earnings 20.4% $ 809,871 $ 672,795
earnings per share:
basic 20.5% $ 2.12 $ 1.76
diluted 20.6% $ 2.11 $ 1.75
cash dividends per share 7.7% $ 0.14 $ 0.13
increase fiscal fiscal
over 1999 2000 1999**
Financial Highlights
In Thousands, Except Per Share Data
* Basis points **Includes the one-time charge of $24.4 million for costs related to the merger with Eagle Hardware & Garden, Inc. on April 2,1999.
Earnings Growth
in millions of dollars
fiscal year
0
5
10
15
20
'94 '95 '96 '97 '98 '99 '00
Sales Growth
in billions of dollars
fiscal year
0
200
400
600
800
'94 '95 '96 '97 '98 '99 '00