Lowe's 2000 Annual Report Download - page 35
Download and view the complete annual report
Please find page 35 of the 2000 Lowe's annual report below. You can navigate through the pages in the report by either clicking on the pages listed below, or by using the keyword search tool below to find specific information within the annual report.-
 1
1 -
2
-
3
-
4
-
5
-
6
-
7
-
8
-
9
-
10
-
11
-
12
-
13
-
14
-
15
-
16
-
17
-
18
-
19
-
20
-
21
-
22
-
23
-
24
-
 25
25 -
 26
26 -
 27
27 -
 28
28 -
 29
29 -
 30
30 -
 31
31 -
 32
32 -
 33
33 -
 34
34 -
 35
35 -
 36
36 -
 37
37 -
 38
38 -
 39
39 -
 40
40 -
 41
41 -
 42
42 -
 43
43 -
 44
44
 |
 |
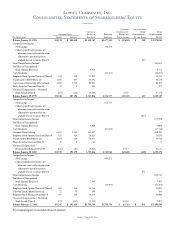
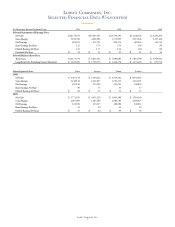
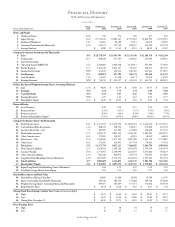
Lowe’s Companies, Inc.
33
The tax effect of cumulative temporary differences that gave
rise to the deferred tax assets and liabilities at February 2, 2001
and January 28, 2000 is as follows:
February 2, 2001
(In Thousands) Assets Liabilities Total
Excess Property and
Store Closing Costs
$ 20,879 – $ 20,879
Insurance
45,228 – 45,228
Depreciation
– $ (272,170) (272,170)
Vacation Accrual
23,220 – 23,220
Other, Net
25,959 (13,522) 12,437
Total
$115,286 $ (285,692) $ (170,406)
January 28, 2000
(In Thousands) Assets Liabilities Total
Excess Property and
Store Closing Costs
$ 28,033 – $ 28,033
Insurance
30,754 – 30,754
Depreciation
– $ (228,707) (228,707)
Vacation Accrual
13,088 – 13,088
Other, Net
19,213 (9,060) 10,153
Total
$ 91,088 $ (237,767) $ (146,679)
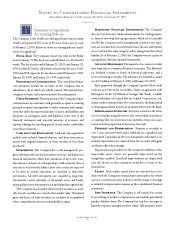
Litigation
The Company is a defendant in legal proceed-
ings considered to be in the normal course of business, none of
which, singularly or collectively, are considered material to the
Company.
Other
Information
Net interest expense is composed of the following:
(In Thousands)
2000 1999 1998
Long-Term Debt
$117,024 $86,675 $68,800
Mortgage Interest
7,667 6,686 7,044
Capitalized Leases
42,041 42,552 39,255
Short-Term Debt
11,638 5,847 5,578
Amortization of Loan Costs
2,631 801 1,144
Interest Income
(25,049) (38,373) (23,300)
Interest Capitalized
(35,127) (19,336) (17,580)
Net Interest Expense
$120,825 $84,852 $80,941
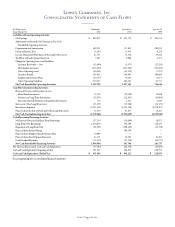
Supplemental Disclosures of Cash Flow Information:
(In Thousands)
2000 1999 1998
Cash Paid for Interest
(Net of Amount Capitalized)
$ 132,457 $ 128,265 $ 112,383
Cash Paid for Income Taxes
$ 428,385 $ 408,366 $ 280,230
Noncash Investing and Financing Activities:
Fixed Assets Acquired under
Capital Leases
$ 1,259 $ 27,573 $ 47,303
Termination of Capital Leases
2,223 – 10,401
Common Stock Issued to ESOP (Note 11)
– 59,544 60,074
Common Stock Issued to Executives and
Directors, net of Unearned Compensation
7,734 12,488 17,853
Conversion of Debt to Common Stock
$ – $ – $ 87,270
Sales by Product Category:
2000 1999 1998
(Dollars in Millions) Total Total Total
Product Category Sales % Sales % Sales %
Appliances
$ 1,922 10% $ 1,341 8% $ 1,037 8%
Lumber/Plywood
1,676 9 1,607 10 1,460 11
Outdoor Fashion
1,323 7 1,102 7 875 7
Nursery
1,247 7 1,006 6 896 7
Millwork
1,197 6 1,021 6 803 6
Building Materials
1,148 6 1,080 7 940 7
Cabinets/Furniture/
Shelving
1,138 6 897 6 662 5
Fashion Electrical
1,135 6 959 6 865 6
Tools
1,124 6 951 6 801 6
Hardware
1,070 6 946 6 770 6
Fashion Plumbing
1,046 6 862 5 762 6
Flooring
1,009 5 726 5 598 4
Paint
996 5 858 5 747 6
Rough Plumbing
& Electrical
993 5 854 5 661 5
Outdoor Power
Equipment
768 4 676 4 521 4
Walls/Windows
452 2 361 2 320 2
Other
535 4 659 6 613 4
Totals
$18,779 100% $15,906 100% $13,331 100%
note
13
note
14