Lowe's 2000 Annual Report Download - page 24
Download and view the complete annual report
Please find page 24 of the 2000 Lowe's annual report below. You can navigate through the pages in the report by either clicking on the pages listed below, or by using the keyword search tool below to find specific information within the annual report.-
 1
1 -
2
-
3
-
4
-
5
-
6
-
7
-
8
-
9
-
10
-
11
-
12
-
13
-
 14
14 -
 15
15 -
 16
16 -
 17
17 -
 18
18 -
 19
19 -
 20
20 -
 21
21 -
 22
22 -
 23
23 -
 24
24 -
 25
25 -
 26
26 -
 27
27 -
 28
28 -
 29
29 -
 30
30 -
 31
31 -
 32
32 -
 33
33 -
 34
34 -
35
-
36
-
37
-
38
-
39
-
40
-
41
-
42
-
43
-
44
 |
 |

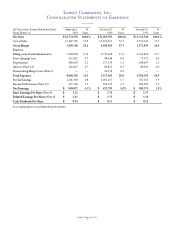
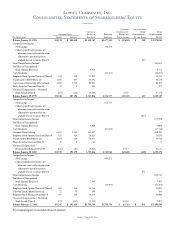
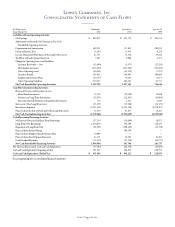
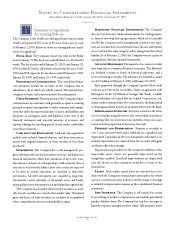
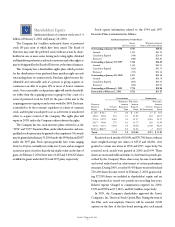
Lowe’s Companies, Inc.
22
(In Thousands, Except Per Share Data) February 2, % January 28, % January 29,%
Years Ended on 2001 Sales 2000 Sales 1999 Sales
Net Sales
$ 18,778,559 100.0% $15,905,595 100.0% $ 13,330,540 100.0%
Cost of Sales
13,487,791 71.8 11,525,013 72.5 9,756,645 73.2
Gross Margin
5,290,768 28.2 4,380,582 27.5 3,573,895 26.8
Expenses:
Selling, General and Administrative
3,348,060 17.8 2,772,428 17.4 2,341,410 17.5
Store Opening Costs
131,825 0.7 98,448 0.6 75,571 0.6
Depreciation
408,618 2.2 337,359 2.1 288,607 2.2
Interest (Note
14
)
120,825 0.7 84,852 0.5 80,941 0.6
Nonrecurring Merger Costs (Note
2
)
— — 24,378 0.2 — —
Total Expenses
4,009,328 21.4 3,317,465 20.8 2,786,529 20.9
Pre-Tax Earnings
1,281,440 6.8 1,063,117 6.7 787,366 5.9
Income Tax Provision (Note
12
)
471,569 2.5 390,322 2.5 286,992 2.1
Net Earnings
$ 809,871 4.3% $ 672,795 4.2% $ 500,374 3.8%
Basic Earnings Per Share (Note
8
)
$ 2.12 $ 1.76 $ 1.35
Diluted Earnings Per Share (Note
8
)
$ 2.11 $ 1.75 $ 1.34
Cash Dividends Per Share
$ 0.14 $ 0.13 $ 0.12
See accompanying notes to consolidated financial statements.
Lowe’s Companies, Inc.
Consolidated Statements of Earnings