Lowe's 2000 Annual Report Download - page 27
Download and view the complete annual report
Please find page 27 of the 2000 Lowe's annual report below. You can navigate through the pages in the report by either clicking on the pages listed below, or by using the keyword search tool below to find specific information within the annual report.-
 1
1 -
2
-
3
-
4
-
5
-
6
-
7
-
8
-
9
-
10
-
11
-
12
-
13
-
14
-
15
-
16
-
 17
17 -
 18
18 -
 19
19 -
 20
20 -
 21
21 -
 22
22 -
 23
23 -
 24
24 -
 25
25 -
 26
26 -
 27
27 -
 28
28 -
 29
29 -
 30
30 -
 31
31 -
 32
32 -
 33
33 -
 34
34 -
 35
35 -
 36
36 -
 37
37 -
38
-
39
-
40
-
41
-
42
-
43
-
44
 |
 |

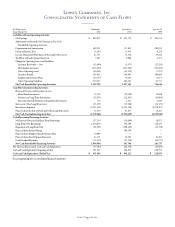
Lowe’s Companies, Inc.
25
(In Thousands) February 2, January 28, January 29,
Years Ended On 2001 2000 1999
Cash Flows From Operating Activities:
Net Earnings
$ 809,871 $ 672,795 $ 500,374
Adjustments to Reconcile Net Earnings to Net Cash
Provided By Operating Activities:
Depreciation and Amortization
409,511 337,822 289,052
Deferred Income Taxes
23,284 13,439 8,226
Loss on Disposition/Writedown of Fixed and Other Assets
22,733 51,520 24,018
Tax Effect of Stock Options Exercised
7,465 9,888 4,371
Changes in Operating Assets and Liabilities:
Accounts Receivable — Net
(13,084) (3,973) (25,520)
Merchandise Inventory
(473,009) (427,661) (399,660)
Other Operating Assets
(66,243) (61,319) (7,937)
Accounts Payable
165,011 346,403 184,660
Employee Retirement Plans
(26,357) 76,024 75,675
Other Operating Liabilities
270,527 182,223 92,757
Net Cash Provided by Operating Activities
1,129,709 1,197,161 746,016
Cash Flows from Investing Activities:
(Increase) Decrease in Investment Assets:
Short-Term Investments
75,738 (50,998) 19,848
Purchases of Long-Term Investments
(13,951) (12,413) (19,866)
Proceeds from Sale/Maturity of Long-Term Investments
750 2,531 2,644
Increase in Other Long-Term Assets
(51,675) (53,028) (21,723)
Fixed Assets Acquired
(2,331,922) (1,472,348) (1,078,107)
Proceeds from the Sale of Fixed and Other Long-Term Assets
71,399 67,837 38,202
Net Cash Used in Investing Activities
(2,249,661) (1,518,419) (1,059,002)
Cash Flows from Financing Activities:
Net Increase (Decrease) in Short-Term Borrowings
157,354 (24,600) 18,971
Long-Term Debt Borrowings
1,014,878 394,588 328,159
Repayment of Long-Term Debt
(61,285) (108,309) (23,318)
Proceeds from Stock Offering
— 348,300 —
Proceeds from Employee Stock Purchase Plan
14,889 — —
Proceeds from Stock Options Exercised
12,131 21,085 10,102
Cash Dividend Payments
(53,479) (47,558) (50,757)
Net Cash Provided by Financing Activities
1,084,488 583,506 283,157
Net Increase (Decrease) in Cash and Cash Equivalents
(35,464) 262,248 (29,829)
Cash and Cash Equivalents, Beginning of Year
491,122 228,874 258,703
Cash and Cash Equivalents, End of Year
$ 455,658 $ 491,122 $ 228,874
See accompanying notes to consolidated financial statements.
Lowe’s Companies, Inc.
Consolidated Statements of Cash Flows