Lowe's 2000 Annual Report Download - page 36
Download and view the complete annual report
Please find page 36 of the 2000 Lowe's annual report below. You can navigate through the pages in the report by either clicking on the pages listed below, or by using the keyword search tool below to find specific information within the annual report.-
 1
1 -
2
-
3
-
4
-
5
-
6
-
7
-
8
-
9
-
10
-
11
-
12
-
13
-
14
-
15
-
16
-
17
-
18
-
19
-
20
-
21
-
22
-
23
-
24
-
25
-
 26
26 -
 27
27 -
 28
28 -
 29
29 -
 30
30 -
 31
31 -
 32
32 -
 33
33 -
 34
34 -
 35
35 -
 36
36 -
 37
37 -
 38
38 -
 39
39 -
 40
40 -
 41
41 -
 42
42 -
 43
43 -
 44
44
 |
 |

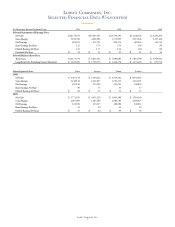
Lowe’s Companies, Inc.
34
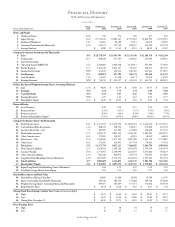
Lowe’s Companies, Inc.
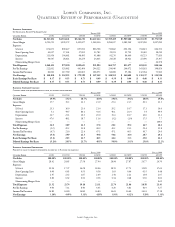
Quarterly Review of Performance (Unaudited)
Earnings Statements
(In Thousands, Except Per Share Data) Fiscal 2000 Fiscal 1999
Quarter Ended 2/2/01 10/27/00 7/28/00 4/28/00 1/28/00 10/29/99 7/30/99 4/30/99
Net Sales
$4,543,052 $4,504,141 $5,264,252 $4,467,114 $3,789,269 $3,909,188 $4,435,219 $3,771,919
Gross Margin
1,291,253 1,299,372 1,452,027 1,248,116 1,096,657 1,089,549 1,187,286 1,007,090
Expenses:
S,G & A
874,873 809,427 857,052 806,708 710,862 692,394 704,821 664,351
Store Opening Costs
41,027 37,161 27,852 25,785 39,051 25,722 15,465 18,210
Depreciation
111,954 104,681 98,495 93,488 91,276 86,440 81,723 77,920
Interest
40,567 28,021 26,224 26,013 20,528 18,921 22,096 23,307
Nonrecurring Merger Costs
———————24,378
Total Expenses
1,068,421 979,290 1,009,623 951,994 861,717 823,477 824,105 808,166
Pre-Tax Earnings
222,832 320,082 442,404 296,122 234,940 266,072 363,181 198,924
Income Tax Provision
82,002 117,789 162,805 108,973 86,008 97,384 132,964 73,966
Net Earnings
$ 140,830 $ 202,293 $ 279,599 $ 187,149 $ 148,932 $ 168,688 $ 230,217 $ 124,958
Basic Earnings Per Share
$ 0.37 $ 0.53 $ 0.73 $ 0.49 $ 0.39 $ 0.44 $ 0.60 $ 0.33
Diluted Earnings Per Share
$ 0.37 $ 0.53 $ 0.73 $ 0.49 $ 0.39 $ 0.44 $ 0.60 $ 0.33
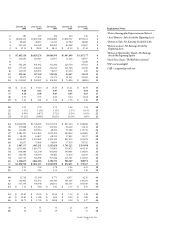
Earnings Statement Changes
Changes from same quarter previous year, to nearest tenth percent
Fiscal 2000 Fiscal 1999
Quarter Ended 2/2/01 10/27/00 7/28/00 4/28/00 1/28/00 10/29/99 7/30/99 4/30/99
Net Sales
19.9% 15.2% 18.7% 18.4% 19.6% 19.2% 18.8% 19.8%
Gross Margin
17.7 19.3 22.3 23.9 25.4 23.5 20.3 21.3
Expenses:
S,G & A
23.1 16.9 21.6 21.4 20.2 19.7 17.1 16.6
Store Opening Costs
5.1 44.5 80.1 41.6 40.1 26.4 3.4 49.9
Depreciation
22.7 21.1 20.5 20.0 19.4 18.7 16.0 13.2
Interest
97.6 48.1 18.7 11.6 (3.2) (1.9) 17.5 7.7
Nonrecurring Merger Costs
— — — — — — — 100.0
Total Expenses
24.0 18.9 22.5 17.8 20.2 19.2 16.7 20.2
Pre-Tax Earnings
(5.2) 20.3 21.8 48.9 49.3 39.1 29.4 25.8
Income Tax Provision
(4.7) 21.0 22.4 47.3 47.1 40.3 30.7 29.0
Net Earnings
(5.4) 19.9 21.5 49.8 50.6 38.4 28.7 24.1
Basic Earnings Per Share
(5.1) 20.5 21.7 48.5 44.4 33.3 25.0 22.2
Diluted Earnings Per Share
(5.1)% 20.5% 21.7% 48.5% 50.0% 33.3% 25.0% 22.2%
Earnings Statement Percentages
Percent of sales to nearest hundredth; income tax is % of pre-tax earnings
Fiscal 2000 Fiscal 1999
Quarter Ended 2/2/01 10/27/00 7/28/00 4/28/00 1/28/00 10/29/99 7/30/99 4/30/99
Net Sales
100.00% 100.00% 100.00% 100.00% 100.00% 100.00% 100.00% 100.00%
Gross Margin
28.42 28.85 27.58 27.94 28.94 27.87 26.77 26.70
Expenses:
S,G & A
19.26 17.97 16.28 18.06 18.76 17.71 15.89 17.61
Store Opening Costs
0.90 0.83 0.53 0.58 1.03 0.66 0.35 0.48
Depreciation
2.47 2.32 1.87 2.09 2.41 2.21 1.84 2.07
Interest
0.89 0.62 0.50 0.58 0.54 0.48 0.50 0.62
Nonrecurring Merger Costs
———————0.65
Total Expenses
23.52 21.74 19.18 21.31 22.74 21.06 18.58 21.43
Pre-Tax Earnings
4.90 7.11 8.40 6.63 6.20 6.81 8.19 5.27
Income Tax Provision
36.80 36.80 36.80 36.80 36.61 36.60 36.61 37.18
Net Earnings
3.10% 4.49% 5.31% 4.19% 3.93% 4.32% 5.19% 3.31%