Lowe's 2000 Annual Report Download - page 31
Download and view the complete annual report
Please find page 31 of the 2000 Lowe's annual report below. You can navigate through the pages in the report by either clicking on the pages listed below, or by using the keyword search tool below to find specific information within the annual report.-
 1
1 -
2
-
3
-
4
-
5
-
6
-
7
-
8
-
9
-
10
-
11
-
12
-
13
-
14
-
15
-
16
-
17
-
18
-
19
-
20
-
 21
21 -
 22
22 -
 23
23 -
 24
24 -
 25
25 -
 26
26 -
 27
27 -
 28
28 -
 29
29 -
 30
30 -
 31
31 -
 32
32 -
 33
33 -
 34
34 -
 35
35 -
 36
36 -
 37
37 -
 38
38 -
 39
39 -
 40
40 -
 41
41 -
42
-
43
-
44
 |
 |

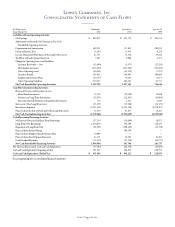
Lowe’s Companies, Inc.
29
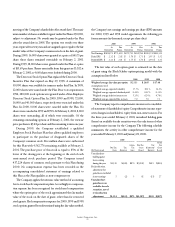
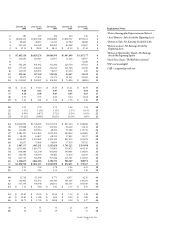
Debt maturities, exclusive of capital leases, for the next five
fiscal years are as follows (in millions): 2001, $26.3; 2002, $43.3;
2003, $12.0; 2004, $59.2; 2005, $612.7.
The Company’s debentures, senior notes and medium term
notes contain certain financial covenants, including the mainte-
nance of specific financial ratios. The Company was in compliance
with these covenants at February 2, 2001 and January 28, 2000.
In February 2001, the Company issued $1.005 billion principal
of Liquid Yield OptionTM Notes (LYONs) at an issue price of
$608.41 per LYON. Interest will not be paid on the LYONs prior
to maturity. On February 16, 2021, the maturity date, the holders
will receive $1,000 per LYON, representing a yield to maturity of
2.5%. Holders may convert their LYONs at any time on or before
the maturity date, unless the LYONs have been purchased or
redeemed previously, into 8.224 shares of the Company’s common
stock per LYON. The Company may redeem for cash all or a por-
tion of the LYONs at any time on or after February 16, 2004 at a
price equal to the sum of the issue price and accrued original issue
discount on the redemption date. Holders of the LYONs may
require the Company to purchase all or a portion of their LYONs
on February 16, 2004 at a price of $655.49 per LYON or on
February 16, 2011 at a price of $780.01 per LYON. The Company
may choose to pay the purchase price of the LYONs in cash or
common stock, or a combination of cash and common stock. In
addition, if a change in control of the Company occurs on or before
February 16, 2004, each holder may require the Company to pur-
chase, for cash, all or a portion of the holder’s LYONs.
1Real properties pledged as collateral for secured debt had net book values at
February 2, 2001, as follows: mortgage notes $164.7 million and other notes
$29.1 million.
2Approximately 37% of these Medium Term Notes may be put at the option
of the holder on either the tenth or twentieth anniversary date of the issue. None
of these notes are currently putable.
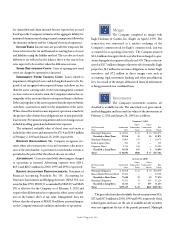
Financial Instruments
Cash and cash equivalents, accounts receiv-
able, short-term borrowings, trade accounts payable, and accrued
liabilities are reflected in the financial statements at cost which
approximates fair value. Short and long-term investments, classi-
fied as available-for-sale securities, are reflected in the financial
statements at fair value. Estimated fair values for long-term debt
have been determined using available market information and
appropriate valuation methodologies. However, considerable
judgement is required in interpreting market data to develop the
estimates of fair value. Accordingly, the estimates presented here-
in are not necessarily indicative of the amounts that the Company
could realize in a current market exchange. The use of different
market assumptions and/or estimation methodologies may have a
material effect on the estimated fair value amounts. The fair value of
the Company’s long-term debt excluding capital leases is as follows:
February 2, 2001 January 28, 2000
Carrying Fair Carrying Fair
(In Thousands) Amount Value Amount Value
Liabilities:
Long-Term Debt
(Excluding Capital Leases)
$2,271,284 $2,271,729 $1,300,671 $1,202,311
Interest rates that are currently available to the Company for
issuance of debt with similar terms and remaining maturities are
used to estimate fair value for debt issues that are not quoted on
an exchange.
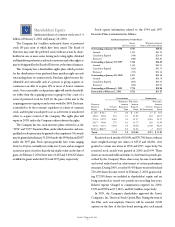
Earnings Per Share
Basic earnings per share (EPS) excludes dilu-
tion and is computed by dividing net earnings by the weighted-
average number of common shares outstanding for the period.
Diluted EPS includes the dilutive effects of common stock equiva-
lents and convertible debt, as applicable. Following is the reconcil-
iation of EPS for 2000, 1999 and 1998.
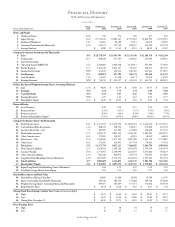
(In Thousands, Except Per Share Data) 2000 1999 1998
Basic Earnings per Share:
Net Earnings $ 809,871 $672,795 $500,374
Weighted Average Shares
Outstanding
382,798 381,240 370,812
Basic Earnings per Share
$ 2.12 $ 1.76 $ 1.35
Diluted Earnings per Share:
Net Earnings
$ 809,871 $ 672,795 $ 500,374
Net Earnings Adjustment for
Convertible Debt
– – 3,589
Net Earnings, as Adjusted
$ 809,871 $ 672,795 $ 503,963
Weighted Average Shares
Outstanding
382,798 381,240 370,812
Dilutive Effect of Stock Options
1,677 2,614 1,954
Dilutive Effect of Convertible Debt
– – 2,985
Weighted Average Shares,
as Adjusted
384,475 383,854 375,751
Diluted Earnings per Share
$ 2.11 $ 1.75 $ 1.34
note
7
note
8