Lowe's 2003 Annual Report Download - page 24
Download and view the complete annual report
Please find page 24 of the 2003 Lowe's annual report below. You can navigate through the pages in the report by either clicking on the pages listed below, or by using the keyword search tool below to find specific information within the annual report.-
 1
1 -
2
-
3
-
4
-
5
-
6
-
7
-
8
-
9
-
10
-
11
-
12
-
13
-
 14
14 -
 15
15 -
 16
16 -
 17
17 -
 18
18 -
 19
19 -
 20
20 -
 21
21 -
 22
22 -
 23
23 -
 24
24 -
 25
25 -
 26
26 -
 27
27 -
 28
28 -
 29
29 -
 30
30 -
 31
31 -
 32
32 -
 33
33 -
 34
34 -
35
-
36
-
37
-
38
-
39
-
40
-
41
-
42
-
43
-
44
-
45
-
46
-
47
-
48
 |
 |

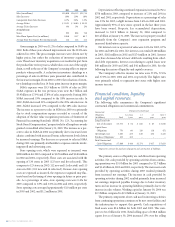
22 LOWE’S COMPANIES, INC.
2003 2002 2001
Sales (in millions) $30,838 $26,112 $21,714
Sales Increases 18% 20% 18%
Comparable Store Sales Increases 6.7% 5.8% 2.5%
Average Ticket $ 59.21 $ 56.80 $ 55.05
Average Ticket Increases 4% 3% 2%
At end of year:
Stores 952 828 718
Sales Floor Square Feet (in millions) 108.8 94.7
80.7
Average Store Size Square Feet (in thousands) 114 114
112
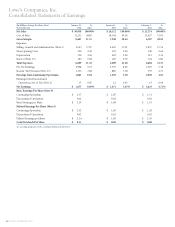
Gross margin in 2003 was 31.2% of sales compared to 30.4% in
2002. Both of these years showed improvement over the 29.0% rate
achieved in 2001. The gross margin increases were driven not by
higher prices, but rather the reduction of inventory acquisition
costs. These lower inventory acquisition costs resulted in part from
the product line review process, which takes costs out of the supply
chain, as well as the use of the Company’s sourcing offices to import
products when possible. A reduction in inventory shrinkage as a
percentage of sales in all three years presented also contributed to
the increase in margin. From 2002 to 2003, the reduction of inven-
tory shrinkage resulted in a 14 basis point increase in gross margin.
SG&A expenses were $5.5 billion or 18.0% of sales in 2003.
SG&A expenses in the two previous years were $4.7 billion and
$3.9 billion or 17.9% and 17.8% of sales, respectively. During 2003,
SG&A increased 19% compared to the 18% increase in sales. In
2002, SG&A increased 21% compared to the 20% sales increase. In
2001, SG&A increased 17% compared to the 18% sales increase.
The increase as a percent to sales in SG&A in 2003 was primarily
due to stock compensation expense recorded as a result of the
adoption of the fair value recognition provisions of Statement of
Financial Accounting Standards (SFAS) No. 123, “Accounting for
Stock-Based Compensation,”prospectively for all employee awards
granted or modified after January 31, 2003. The increase as a per-
cent to sales in SG&A in 2002 was primarily due to increased store
salaries combined with increased bonus achievement levels driven
by increased earnings. The decrease as a percent to sales in SG&A
during 2001 was primarily attributable to expense controls involv-
ing payroll and advertising costs.
Store opening costs, which were expensed as incurred, were
$128 million for 2003 compared to $129 million and $140 million
in 2002 and 2001, respectively. These costs are associated with the
opening of 130 stores in 2003 (125 new and five relocated). This
compares to 123 stores in 2002 (112 new and 11 relocated) and 115
stores in 2001 (101 new and 14 relocated). Because store opening
costs are expensed as incurred, the expenses recognized may fluc-
tuate based on the timing of store openings in future or prior peri-
ods. As a percentage of sales, store opening costs were 0.4% for
2003 compared to 0.5% and 0.6% in 2002 and 2001, respectively.
Store opening costs averaged approximately $1.0 million per store
in 2003 and 2002, and $1.2 million in 2001.
Depreciation, reflecting continued expansion, increased 22% to
$758 million in 2003, compared to increases of 21% and 26% in
2002 and 2001, respectively. Depreciation as a percentage of sales
was 2.5% for 2003, a slight increase from 2.4% in 2002 and 2001.
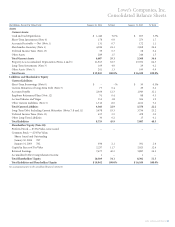
Approximately 95% of new stores opened in the last three years
have been owned. Property, less accumulated depreciation,
increased to $11.9 billion at January 30, 2004 compared to
$10.4 billion at January 31, 2003. The increase in property resulted
primarily from the Company’s store expansion program and
increased distribution capacity.
Net interest costs as a percent of sales were 0.6% for 2003, 0.7%
for 2002 and 0.8% for 2001. Net interest costs totaled $180 million
in 2003, $182 million in 2002 and $174 million in 2001. Interest
costs have decreased due to lower debt levels resulting from sched-
uled debt repayments. Interest costs relating to capital leases were
$40 million for 2003 and 2002 and $41 million for 2001. See the
following discussion of liquidity and capital resources.
The Company’s effective income tax rates were 37.9%, 37.6%
and 37.0% in 2003, 2002 and 2001, respectively. The higher rates
were primarily related to expansion into states with higher state
income tax rates.
Financial condition, liquidity
and capital resources.
The following table summarizes the Company’s significant
contractual obligations and commercial commitments.
Payments Due by Period
Contractual ––––––––––––––––––––––––––––––––––––––––––––––––––––––––––––––––––––––––––––––––––––––––––––––––––––––––––––––––––––––––––––––––––––––––––––––––––––––––––––––––––
Obligations Less than 1-3 4-5 After 5
(In Millions) Total 1 year years years years
Long-Term Debt
(net of discount) $ 3,773 $ 54 $ 616 $ 67 $ 3,036
Capital Lease
Obligations 770 60 120 118 472
Operating Leases 3,220 225 438 432 2,125
Purchase Obligations1105 105 – – –
Total Contractual
Cash Obligations $ 7,868 $ 444 $1,174 $ 617 $ 5,633
1Represents contracts for purchases of property and construction of buildings.
The primary sources of liquidity are cash flows from operating
activities. Net cash provided by operating activities from continu-
ing operations was $3.0 billion for 2003 compared to $2.7 billion
and $1.6 billion in 2002 and 2001, respectively. The increase in cash
provided by operating activities during 2003 resulted primarily
from increased net earnings. The increase in cash provided by
operating activities during 2002 resulted primarily from increased
net earnings, improved payables leverage due to better inventory
turns and an increase in operating liabilities primarily due to the
increase in sales volume. Working capital at January 30, 2004 was
$2.3 billion compared to $2.0 billion at January 31, 2003.
The primary component of net cash used in investing activities
from continuing operations continues to be new store facilities and
the infrastructure to support this growth. Cash acquisitions of
fixed assets were $2.4 billion for both 2003 and 2002. This com-
pares to $2.2 billion for 2001. Retail selling space of 108.8 million
square feet as of January 30, 2004 increased 15% over the selling