Lowe's 2003 Annual Report Download - page 29
Download and view the complete annual report
Please find page 29 of the 2003 Lowe's annual report below. You can navigate through the pages in the report by either clicking on the pages listed below, or by using the keyword search tool below to find specific information within the annual report.-
 1
1 -
2
-
3
-
4
-
5
-
6
-
7
-
8
-
9
-
10
-
11
-
12
-
13
-
14
-
15
-
16
-
17
-
18
-
 19
19 -
 20
20 -
 21
21 -
 22
22 -
 23
23 -
 24
24 -
 25
25 -
 26
26 -
 27
27 -
 28
28 -
 29
29 -
 30
30 -
 31
31 -
 32
32 -
 33
33 -
 34
34 -
 35
35 -
 36
36 -
 37
37 -
 38
38 -
 39
39 -
40
-
41
-
42
-
43
-
44
-
45
-
46
-
47
-
48
 |
 |

2003 ANNUAL REPORT 27
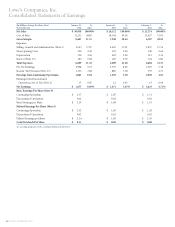
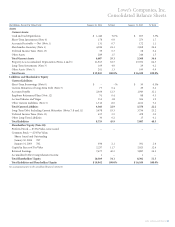
Lowe’s Companies, Inc.
Consolidated Balance Sheets
(In Millions, Except Par Value Data) January 30, 2004 % Total January 31, 2003 % Total
Assets
Current Assets:
Cash and Cash Equivalents $ 1,446 7.6% $ 853 5.3%
Short-Term Investments (Note 3) 178 0.9 273 1.7
Accounts Receivable — Net (Note 1) 131 0.7 172 1.1
Merchandise Inventory (Note 1) 4,584 24.1 3,968 24.6
Deferred Income Taxes (Note 13) 59 0.3 58 0.4
Other Assets 289 1.5 244 1.5
Total Current Assets 6,687 35.1 5,568 34.6
Property, Less Accumulated Depreciation (Notes 4 and 5) 11,945 62.7 10,352 64.3
Long-Term Investments (Note 3) 169 0.9 29 0.2
Other Assets (Note 5) 241 1.3 160 0.9
Total Assets $ 19,042 100.0% $ 16,109 100.0%
Liabilities and Shareholders’ Equity
Current Liabilities:
Short-Term Borrowings (Note 6) $ – – % $ 50 0.3%
Current Maturities of Long-Term Debt (Note 7) 77 0.4 29 0.2
Accounts Payable 2,366 12.3 1,943 12.1
Employee Retirement Plans (Note 12) 74 0.4 88 0.5
Accrued Salaries and Wages 335 1.8 306 1.9
Other Current Liabilities (Note 5) 1,516 8.0 1,162 7.2
Total Current Liabilities 4,368 22.9 3,578 22.2
Long-Term Debt, Excluding Current Maturities (Notes 7, 8 and 11) 3,678 19.3 3,736 23.2
Deferred Income Taxes (Note 13) 657 3.5 478 3.0
Other Long-Term Liabilities 30 0.2 15 0.1
Total Liabilities 8,733 45.9 7,807 48.5
Shareholders’ Equity (Note 10):
Preferred Stock — $5 Par Value, none issued – – – –
Common Stock — $.50 Par Value;
Shares Issued and Outstanding
January 30, 2004 787
January 31, 2003 782 394 2.1 391 2.4
Capital in Excess of Par Value 2,237 11.7 2,023 12.6
Retained Earnings 7,677 40.3 5,887 36.5
Accumulated Other Comprehensive Income 1 – 1 –
Total Shareholders’ Equity 10,309 54.1 8,302 51.5
Total Liabilities and Shareholders’ Equity $ 19,042 100.0% $ 16,109 100.0%
See accompanying notes to the consolidated financial statements.