Lowe's 2003 Annual Report Download - page 44
Download and view the complete annual report
Please find page 44 of the 2003 Lowe's annual report below. You can navigate through the pages in the report by either clicking on the pages listed below, or by using the keyword search tool below to find specific information within the annual report.-
 1
1 -
2
-
3
-
4
-
5
-
6
-
7
-
8
-
9
-
10
-
11
-
12
-
13
-
14
-
15
-
16
-
17
-
18
-
19
-
20
-
21
-
22
-
23
-
24
-
25
-
26
-
27
-
28
-
29
-
30
-
31
-
32
-
33
-
 34
34 -
 35
35 -
 36
36 -
 37
37 -
 38
38 -
 39
39 -
 40
40 -
 41
41 -
 42
42 -
 43
43 -
 44
44 -
 45
45 -
 46
46 -
 47
47 -
 48
48
 |
 |

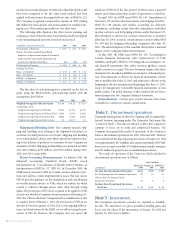
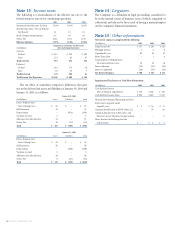
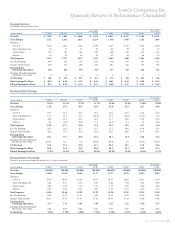
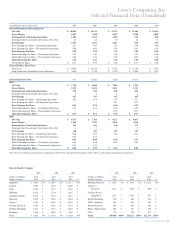
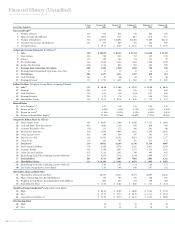
42 LOWE’S COMPANIES, INC.
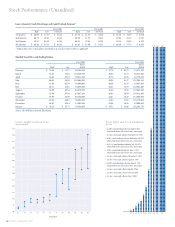
Financial History (Unaudited)
10-year financial information
*
5-year January 30, January 31, February 1, February 2, January 28,
Fiscal Years Ended On CGR 2004 2003 2002 2001 2000
Stores and People1
1Number of Stores 13.9 952 828 718 624 550
2Square Footage (In Millions) 17.9 108.8 94.7 80.7 67.8 57.0
3Number of Employees 15.4 147,052 120,692 107,404 93,669 85,145
4Customer Transactions (In Millions) 14.2 521 460 394 342 299
5Average Purchase $ 59.21 $ 56.80 $ 55.05 $ 53.78 $ 51.73
Comparative Income Statements (In Millions)1
6 Sales 19.0 $ 30,838 $ 26,112 $ 21,714 $ 18,368 $ 15,445
7Depreciation 21.6 758 622 513 405 332
8Interest 17.3 180 182 174 121 85
9Pre-Tax Earnings 31.4 2,998 2,339 1,603 1,258 1,038
10 Income Tax Provision NM 1,136 880 593 462 380
11 Earnings from Continuing Operations 30.8 1,862 1,459 1,010 796 658
12 Earnings from Discontinued Operations, Net of Tax 3.2 15 12 13 14 15
13 Net Earnings 30.3 1,877 1,471 1,023 810 673
14 Cash Dividends 16.2 87 66 60 53 48
15 Earnings Retained 31.3 $ 1,790 $ 1,405 $ 963 $ 757 $ 625
Dollars Per Share (Weighted Average Shares, Assuming Dilution)
16 Sales117.3 $ 38.26 $ 32.64 $ 27.31 $ 23.89 $ 20.11
17 Earnings 28.4 2.34 1.85 1.30 1.05 0.88
18 Cash Dividends 12.9 0.11 0.09 0.08 0.07 0.06
19 Earnings Retained 29.5 2.22 1.76 1.21 0.98 0.81
20 Shareholders’ Equity 21.6 $ 12.79 $ 10.38 $ 8.40 $ 7.15 $ 6.12
Financial Ratios
21 Asset Turnover1, 2 1.91 1.90 1.91 2.04 2.18
22 Return on Sales1, 3 6.09% 5.63% 4.71% 4.41% 4.36%
23 Return on Assets411.65% 10.71% 9.01% 8.99% 9.50%
24 Return on Shareholders’ Equity522.61% 22.04% 18.62% 17.25% 18.59%
Comparative Balance Sheets (In Millions)
25 Total Current Assets 18.5 $ 6,687 $ 5,568 $ 4,920 $ 4,157 $ 3,688
26 Cash and Short-Term Investments 45.5 1,624 1,126 853 469 569
27 Accounts Receivable—Net (1.9) 131 172 166 161 148
28 Merchandise Inventory 14.0 4,584 3,968 3,611 3,285 2,812
29 Other Current Assets 45.1 289 244 197 161 105
30 Fixed Assets—Net 23.9 11,945 10,352 8,653 7,035 5,177
31 Other Assets 17.5 241 160 141 131 111
32 Total Assets 21.9 19,042 16,109 13,736 11,358 9,007
33 Total Current Liabilities 17.8 4,368 3,578 3,017 2,911 2,380
34 Accounts Payable 14.2 2,366 1,943 1,715 1,714 1,561
35 Other Current Liabilities 41.2 1,516 1,162 796 662 401
36 Equity/Long-Term Debt, Excluding Current Maturities 21.9 3,678 3,736 3,734 2,698 1,727
37 Total Liabilities 20.3 8,733 7,807 7,062 5,863 4,311
38 Shareholders’ Equity 23.3 $ 10,309 $ 8,302 $ 6,674 $ 5,495 $ 4,695
39 Equity/Long-Term Debt, Excluding Current Maturities 2.80 2.22 1.79 2.04 2.72
40 Year-End Leverage Factor: Assets/Equity 1.85 1.94 2.06 2.07 1.92
Shareholders, Shares and Book Value
41 Shareholders of Record, Year-End 26,553 25,405 19,277 16,895 15,446
42 Shares Outstanding, Year-End (In Millions) 787 782 776 766 765
43 Weighted Average Shares, Assuming Dilution (In Millions) 806 800 795 769 768
44 Book Value Per Share $ 13.10 $ 10.62 $ 8.60 $ 7.17 $ 6.14
Stock Price During Calendar Year6(Adjusted for Stock Splits)
45 High $ 60.42 $ 49.99 $ 48.88 $ 33.63 $ 33.22
46 Low $ 33.37 $ 32.50 $ 24.79 $ 17.13 $ 21.50
47 Closing Price December 31 $ 55.59 $ 36.50 $ 46.41 $ 22.25 $ 29.88
Price/Earnings Ratio
48 High 26 27 38 32 38
49 Low 14 18 19 16 24