Lowe's 2003 Annual Report Download - page 34
Download and view the complete annual report
Please find page 34 of the 2003 Lowe's annual report below. You can navigate through the pages in the report by either clicking on the pages listed below, or by using the keyword search tool below to find specific information within the annual report.-
 1
1 -
2
-
3
-
4
-
5
-
6
-
7
-
8
-
9
-
10
-
11
-
12
-
13
-
14
-
15
-
16
-
17
-
18
-
19
-
20
-
21
-
22
-
23
-
 24
24 -
 25
25 -
 26
26 -
 27
27 -
 28
28 -
 29
29 -
 30
30 -
 31
31 -
 32
32 -
 33
33 -
 34
34 -
 35
35 -
 36
36 -
 37
37 -
 38
38 -
 39
39 -
 40
40 -
 41
41 -
 42
42 -
 43
43 -
 44
44 -
45
-
46
-
47
-
48
 |
 |

32 LOWE’S COMPANIES, INC.
income for year ended January 30, 2004 is less than that which would
have been recognized if the fair value based method had been
applied to all awards since the original effective date of SFAS No.123.
The Company recognized compensation expense in 2003 totaling
$41 million for stock options and awards granted or modified dur-
ing the year. These options generally vest over three years.
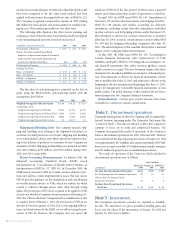
The following table illustrates the effect on net earnings and
earnings per share if the fair-value-based method had been applied
to all outstanding and unvested awards in each period:
(In Millions, Except Per Share Data) 2003 2002 2001
Net Earnings as Reported $ 1,877 $ 1,471 $ 1,023
Deduct: Total Unrecognized Stock-Based
Employee Compensation Expense Determined
Under the Fair-Value-Based Method for All
Awards Net of Related Tax Effects (61) (85) (55)
Pro Forma Net Earnings $ 1,816 $ 1,386 $ 968
Earnings Per Share:
Basic – as Reported $ 2.39 $ 1.89 $ 1.33
Basic – Pro Forma $ 2.31 $ 1.78 $ 1.25
Diluted – as Reported $ 2.34 $ 1.85 $ 1.30
Diluted – Pro Forma $ 2.27 $ 1.73 $ 1.22
The fair value of each option grant is estimated on the date of
grant using the Black-Scholes option-pricing model with the
assumptions listed below.
2003 2002 2001
Weighted Average Fair Value Per Option $ 17.64 $ 19.22 $ 17.39
Assumptions Used:
Weighted Average Expected Volatility 44.0% 43.7% 41.1%
Weighted Average Expected Dividend Yield 0.26% 0.27% 0.23%
Weighted Average Risk-Free Interest Rate 2.89% 4.35% 4.58%
Weighted Average Expected Life, in Years 5.5 4.0-7.0 7.0
Shipping and Handling Costs The Company includes ship-
ping and handling costs relating to the shipment of products to
customers by third parties in cost of sales. Shipping and handling
costs, which include salaries and vehicle operations expenses relat-
ing to the delivery of products to customers by the Company are
classified as SG&A. Shipping and handling costs included in SG&A
were $216 million, $193 million, and $163 million during 2003,
2002, and 2001, respectively.
Recent Accounting Pronouncements In January 2003, the
Financial Accounting Standards Board (FASB) issued
Interpretation 46, “Consolidation of Variable Interest Entities, an
Interpretation of ARB No. 51” (FIN 46). In December 2003, the
FASB issued a revision to FIN 46 to make certain technical correc-
tions and address certain implementation issues that had arisen.
FIN 46 provides guidance on the identification and consolidation
of variable interest entities, or VIEs, which are entities for which
control is achieved through means other than through voting
rights. The provisions of FIN 46 are required to be applied to VIEs
created or in which the Company obtains an interest after January 31,
2003. For VIEs in which the Company holds a variable interest that
it acquired before February 1, 2003, the provisions of FIN 46 are
effective for the first quarter of 2004. Due to the ongoing delibera-
tions and clarifications by the FASB, we are still assessing the pro-
visions of FIN 46. However, the Company does not expect the
adoption of FIN 46 in the first quarter of 2004 to have a material
impact on its financial position, results of operations or cash flows.
In April 2003, the FASB issued SFAS No. 149, “Amendment of
Statement 133 on Derivative Instruments and Hedging Activities.”
SFAS No. 149 amends and clarifies accounting for derivative
instruments, including certain derivative instruments embedded
in other contracts, and for hedging activities under Statement 133.
This Statement is effective for contracts entered into or modified
after June 30, 2003, except in certain instances stated within SFAS
No. 149 and for hedging relationships designated after June 30,
2003. The initial adoption of this standard did not have a material
impact on the Company’s financial statements.
In May 2003, the FASB issued SFAS No. 150, “Accounting for
Certain Financial Instruments with Characteristics of both
Liabilities and Equity.” SFAS No. 150 changes the accounting for cer-
tain financial instruments that, under previous guidance, issuers
could account for as equity. The new Statement requires that those
instruments be classified as liabilities in statements of financial posi-
tion. This Statement is effective for financial instruments entered
into or modified after May 31, 2003, and otherwise is effective at the
beginning of the first interim period beginning after June 15, 2003,
except for mandatorily redeemable financial instruments of non
public entities. The initial adoption of this standard did not have a
material impact on the Company’s financial statements.
Reclassifications Certain prior period amounts have been
reclassified to conform to current classifications.
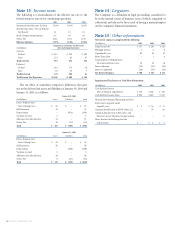
Note 2
|
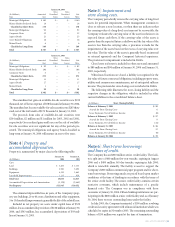
Discontinued operations.
During the fourth quarter of 2003, the Company sold 26 commodity-
focused locations operating under The Contractor Yard name (the
“Contractor Yards”). This sale was effected to allow the Company to
continue to focus on its retail and commercial business. The
Company has reported the results of operations of the Contractor
Yards as discontinued operations for 2003, 2002 and 2001. Total net
assets included in the disposal group and sold as of January 30, 2004
were approximately $111 million, and consisted primarily of $47 mil-
lion in net accounts receivable, $37 million in merchandise inventory
and $27 million in property, less accumulated depreciation.
The results of operations of the Contractor Yards included in
discontinued operations were as follows:
Years Ended On
––––––––––––––––––––––––––––––––––––––––––––––––––––––––––––––––––––––––––––––
January 30, January 31, February 1,
(In Millions) 2004 2003 2002
Net Sales from Discontinued Operations $ 425 $ 379 $ 397
Pre-Tax Earnings from Discontinued Operations
20 20 21
Gain on Sale of Contractor Yards 5 – –
Income Tax Provision 10 8 8
Earnings from Discontinued Operations,
Net of Tax $ 15 $ 12 $ 13
Note 3
|
Investments.
The Company’s investment securities are classified as available-
for-sale. The amortized cost, gross unrealized holding gains and
losses and fair values of the investments at January 30, 2004 and
January 31, 2003 were as follows: