Lowe's 2003 Annual Report Download - page 41
Download and view the complete annual report
Please find page 41 of the 2003 Lowe's annual report below. You can navigate through the pages in the report by either clicking on the pages listed below, or by using the keyword search tool below to find specific information within the annual report.-
 1
1 -
2
-
3
-
4
-
5
-
6
-
7
-
8
-
9
-
10
-
11
-
12
-
13
-
14
-
15
-
16
-
17
-
18
-
19
-
20
-
21
-
22
-
23
-
24
-
25
-
26
-
27
-
28
-
29
-
30
-
 31
31 -
 32
32 -
 33
33 -
 34
34 -
 35
35 -
 36
36 -
 37
37 -
 38
38 -
 39
39 -
 40
40 -
 41
41 -
 42
42 -
 43
43 -
 44
44 -
 45
45 -
 46
46 -
 47
47 -
 48
48
 |
 |

2003 ANNUAL REPORT 39
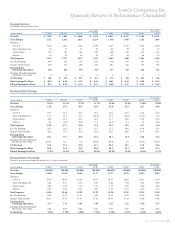
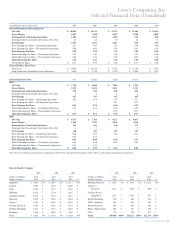
Lowe’s Companies, Inc.
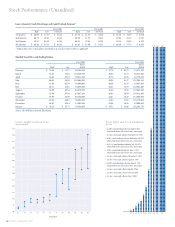
Quarterly Review of Performance (Unaudited)
Earnings Statements
(In Millions, Except Per Share Data)
Fiscal 2003 Fiscal 2002
Quarter Ended 1/30/04 10/31/03 8/1/03 5/2/03 1/31/03 11/1/02 8/2/02 5/3/02
Net Sales $ 7,252 $ 7,802 $ 8,666 $ 7,118 $ 6,037 $ 6,317 $ 7,385 $ 6,373
Gross Margin 2,321 2,441 2,626 2,219 1,918 1,945 2,182 1,903
Expenses:
S G & A 1,378 1,450 1,416 1,299 1,151 1,178 1,219 1,128
Store Opening Costs 45 37 27 19 40 28 24 37
Depreciation 203 192 184 179 168 158 152 144
Interest 45 42 45 48 45 44 46 47
Total Expenses 1,671 1,721 1,672 1,545 1,404 1,408 1,441 1,356
Pre-Tax Earnings 650 720 954 674 514 537 741 547
Income Tax Provision 249 272 360 255 197 201 277 205
Earnings From
Continuing Operations 401 448 594 419 317 336 464 342
Earnings From Discontinued
Operations,Net ofTax 64322334
Net Earnings $ 407 $ 452 $ 597 $ 421 $ 319 $ 339 $ 467 $ 346
Basic Earnings Per Share $ 0.52 $ 0.58 $ 0.76 $ 0.54 $ 0.41 $ 0.44 $ 0.60 $ 0.45
Diluted Earnings Per Share $ 0.51 $ 0.56 $ 0.75 $ 0.53 $ 0.40 $ 0.43 $ 0.59 $ 0.44
Earnings Statement Changes
Changes from same quarter previous year, to nearest tenth percent
Fiscal 2003 Fiscal 2002
Quarter Ended 1/30/04 10/31/03 8/1/03 5/2/03 1/31/03 11/1/02 8/2/02 5/3/02
Net Sales 20.1% 23.5% 17.3% 11.7% 16.8% 18.1% 22.8% 23.0%
Gross Margin 21.0 25.5 20.3 16.6 24.0 23.9 28.7 29.0
Expenses:
S G & A 19.7 23.1 16.2 15.2 16.4 23.0 23.8 21.8
Store Opening Costs 12.5 32.1 12.5 (48.6) 21.2 (34.9) (14.3) 2.8
Depreciation 20.8 21.5 21.1 24.3 21.7 18.8 22.6 22.0
Interest 0.0 (4.5) (2.2) 2.1 (4.3) 2.3 7.0 14.6
Total Expenses 19.0 22.2 16.0 13.9 16.3 19.6 22.1 21.0
Pre-Tax Earnings 26.5 34.1 28.7 23.2 51.2 36.6 43.6 54.5
Income Tax Provision 26.4 35.3 30.0 24.4 56.3 38.6 45.0 56.5
Earnings From
Continuing Operations 26.5 33.3 28.0 22.5 48.1 35.5 42.8 53.4
Earnings From Discontinued
Operations, Net of Tax 200.0 33.3 0.0 (50.0) (50.0) 0.0 (25.0) 100.0
Net Earnings 27.6 33.3 27.8 21.7 46.3 35.1 41.9 53.8
Basic Earnings Per Share 26.8 31.8 26.8 20.0 46.4 37.5 39.5 55.2
Diluted Earnings Per Share 27.5% 30.2% 25.4% 20.5% 42.9% 34.4% 40.5% 51.7%
Earnings Statement Percentages
Percent of sales to nearest hundredth; income tax is % of pre-tax earnings
Fiscal 2003 Fiscal 2002
Quarter Ended 1/30/04 10/31/03 8/1/03 5/2/03 1/31/03 11/1/02 8/2/02 5/3/02
Net Sales 100.00% 100.00% 100.00% 100.00% 100.00% 100.00% 100.00% 100.00%
Gross Margin 32.00 31.29 30.30 31.17 31.77 30.79 29.55 29.86
Expenses:
S G & A 19.00 18.59 16.34 18.25 19.07 18.65 16.51 17.70
Store Opening Costs 0.62 0.47 0.31 0.27 0.66 0.44 0.32 0.58
Depreciation 2.80 2.46 2.12 2.51 2.78 2.50 2.06 2.26
Interest 0.62 0.54 0.52 0.67 0.75 0.70 0.62 0.74
Total Expenses 23.04 22.06 19.29 21.70 23.26 22.29 19.51 21.28
Pre-Tax Earnings 8.96 9.23 11.01 9.47 8.51 8.50 10.04 8.58
Income Tax Provision 38.31 37.78 37.74 37.83 38.33 37.43 37.38 37.48
Earnings From
Continuing Operations 5.53 5.74 6.85 5.89 5.25 5.32 6.28 5.37
Earnings From Discontinued
Operations, Net of Tax 0.08 0.05 0.04 0.02 0.03 0.05 0.04 0.06
Net Earnings 5.61% 5.79% 6.89% 5.91% 5.28% 5.37% 6.32% 5.43%