Lowe's 2003 Annual Report Download - page 4
Download and view the complete annual report
Please find page 4 of the 2003 Lowe's annual report below. You can navigate through the pages in the report by either clicking on the pages listed below, or by using the keyword search tool below to find specific information within the annual report.-
 1
1 -
 2
2 -
 3
3 -
 4
4 -
 5
5 -
 6
6 -
 7
7 -
 8
8 -
 9
9 -
 10
10 -
 11
11 -
 12
12 -
 13
13 -
 14
14 -
 15
15 -
16
-
17
-
18
-
19
-
20
-
21
-
22
-
23
-
24
-
25
-
26
-
27
-
28
-
29
-
30
-
31
-
32
-
33
-
34
-
35
-
36
-
37
-
38
-
39
-
40
-
41
-
42
-
43
-
44
-
45
-
46
-
47
-
48
 |
 |
02 LOWE’S COMPANIES, INC.
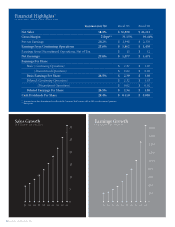
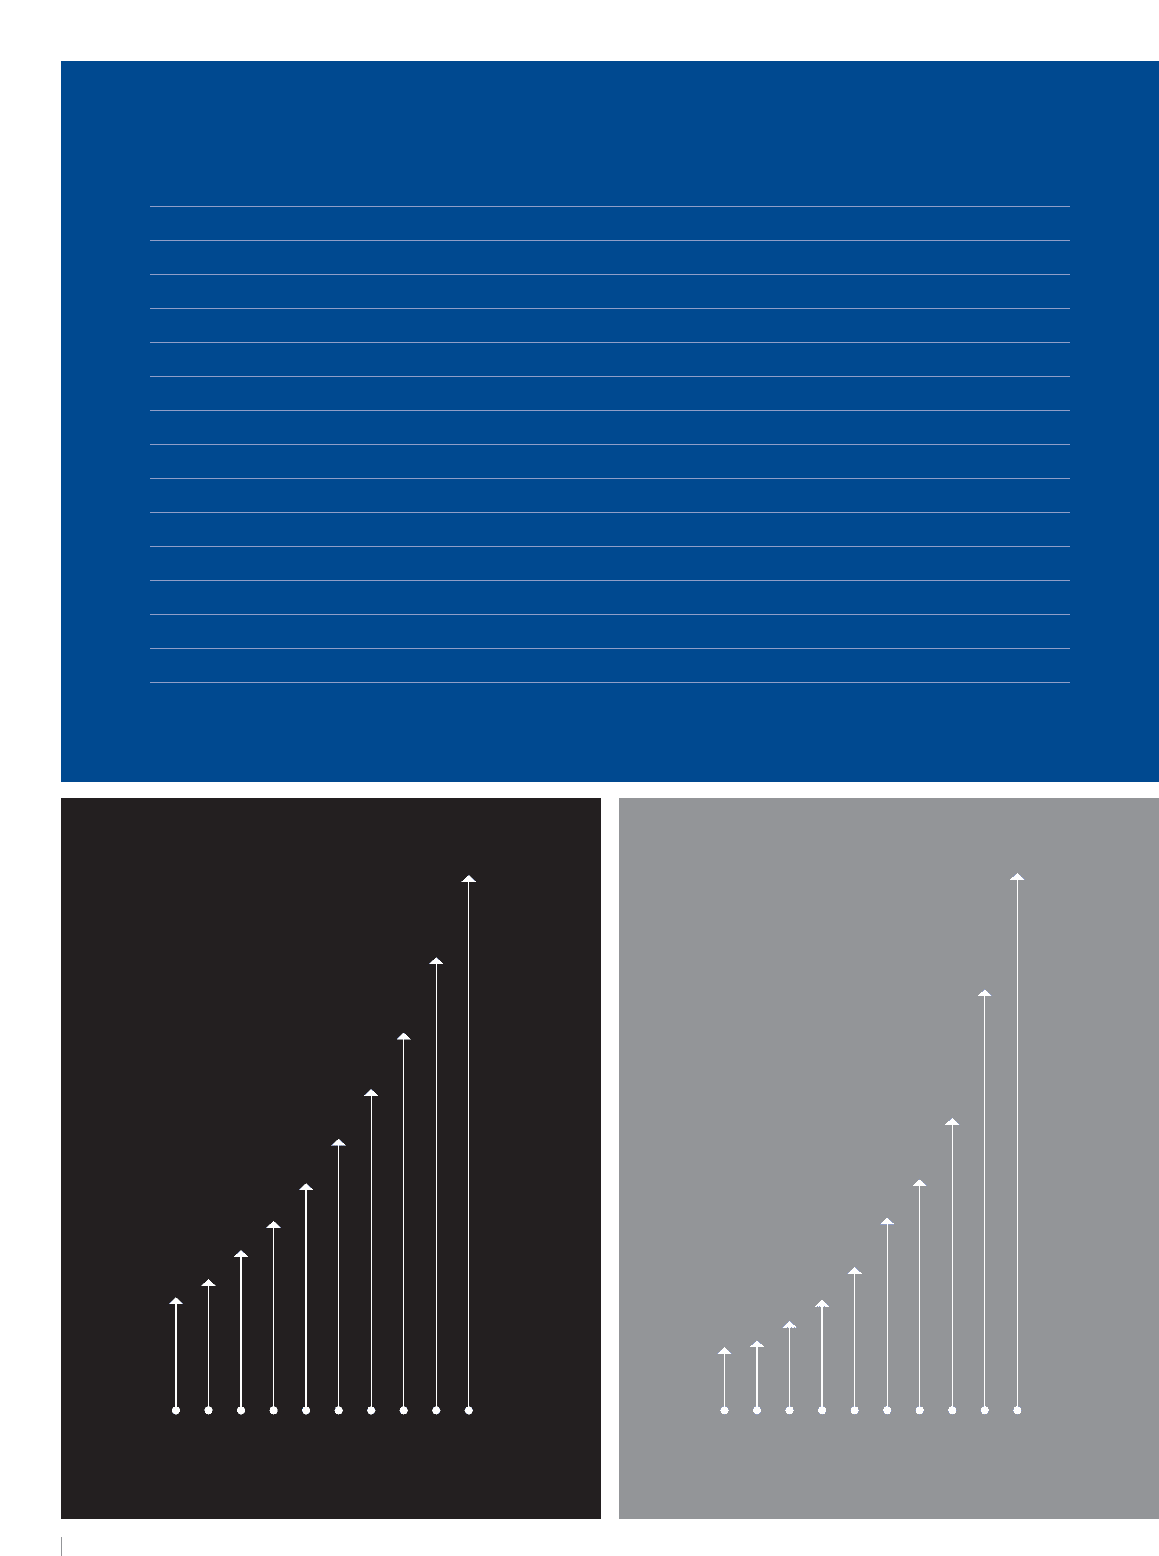
Financial Highlights*
in millions, except per share data
Sales Growth
in billions of dollars
Earnings Growth
in millions of dollars
Increase over ’02 Fiscal ’03 Fiscal ’02
* Amounts herein have been adjusted to reflect the 26 Contractor Yard locations sold in 2003 as a discontinued operation.
** Basis points
Net Sales 18.1% $ 30,838 $ 26,112
Gross Margin 71bps** 31.15% 30.44%
Pre-tax Earnings 28.2% $ 2,998 $ 2,339
Earnings from Continuing Operations 27.6% $ 1,862 $ 1,459
Earnings from Discontinued Operations, Net of Tax $ 15 $ 12
Net Earnings 27.6% $ 1,877 $ 1,471
Earnings Per Share
Basic (Continuing Operations) $ 2.37 $ 1.87
(Discontinued Operations) $ 0.02 $ 0.02
Basic Earnings Per Share 26.5% $ 2.39 $ 1.89
Diluted (Continuing Operations) $ 2.32 $ 1.83
(Discontinued Operations) $ 0.02 $ 0.02
Diluted Earnings Per Share 26.5% $ 2.34 $ 1.85
Cash Dividends Per Share 29.4% $ 0.110 $ 0.085
95 96 97 98 99 00 01 02 0394
0
5
10
15
20
25
30
0
200
400
600
800
1,000
1,200
1,400
1,600
1,800
95 96 97 98 99 00 01 02 0394