Lowe's 2003 Annual Report Download - page 43
Download and view the complete annual report
Please find page 43 of the 2003 Lowe's annual report below. You can navigate through the pages in the report by either clicking on the pages listed below, or by using the keyword search tool below to find specific information within the annual report.-
 1
1 -
2
-
3
-
4
-
5
-
6
-
7
-
8
-
9
-
10
-
11
-
12
-
13
-
14
-
15
-
16
-
17
-
18
-
19
-
20
-
21
-
22
-
23
-
24
-
25
-
26
-
27
-
28
-
29
-
30
-
31
-
32
-
 33
33 -
 34
34 -
 35
35 -
 36
36 -
 37
37 -
 38
38 -
 39
39 -
 40
40 -
 41
41 -
 42
42 -
 43
43 -
 44
44 -
 45
45 -
 46
46 -
 47
47 -
 48
48
 |
 |

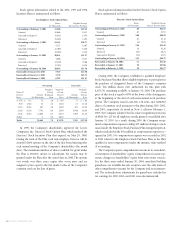
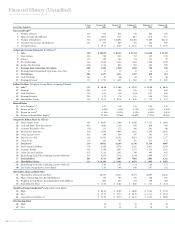
2003 ANNUAL REPORT 41
(In Millions, Except Per Share Data) 2003 2002 2001 2000 1999
Selected Statements of Earnings Data:
Net Sales $ 30,838 $ 26,112 $ 21,714 $ 18,368 $ 15,445
Gross Margin 9,607 7,948 6,287 5,208 4,288
Earnings from Continuing Operations 1,862 1,459 1,010 796 658
Earnings from Discontinued Operations, Net of Tax 15 12 13 14 15
Net Earnings 1,877 1,471 1,023 810 673
Basic Earnings Per Share – Continuing Operations 2.37 1.87 1.31 1.04 0.86
Basic Earnings Per Share – Discontinued Operations 0.02 0.02 0.02 0.02 0.02
Basic Earnings Per Share 2.39 1.89 1.33 1.06 0.88
Diluted Earnings Per Share – Continuing Operations 2.32 1.83 1.28 1.03 0.86
Diluted Earnings Per Share – Discontinued Operations 0.02 0.02 0.02 0.02 0.02
Diluted Earnings Per Share 2.34 1.85 1.30 1.05 0.88
Dividends Per Share $ 0.11 $ 0.09 $ 0.08 $ 0.07 $ 0.06
Selected Balance Sheet Data:
Total Assets $ 19,042 $ 16,109 $ 13,736 $ 11,358 $ 9,007
Long-Term Debt, Excluding Current Maturities $ 3,678 $ 3,736 $ 3,734 $ 2,698 $ 1,727
Selected Quarterly Data: First Second Third Fourth
2003
Net Sales $ 7,118 $ 8,666 $ 7,802 $ 7,252
Gross Margin 2,219 2,626 2,441 2,321
Earnings from Continuing Operations 419 594 448 401
Earnings from Discontinued Operations, Net of Tax 2346
Net Earnings 421 597 452 407
Basic Earnings Per Share – Continuing Operations 0.54 0.76 0.57 0.51
Basic Earnings Per Share – Discontinued Operations – – 0.01 0.01
Basic Earnings Per Share 0.54 0.76 0.58 0.52
Diluted Earnings Per Share – Continuing Operations 0.53 0.75 0.55 0.50
Diluted Earnings Per Share – Discontinued Operations – – 0.01 0.01
Diluted Earnings Per Share $ 0.53 $ 0.75 $ 0.56 $ 0.51
2002
Net Sales $ 6,373 $ 7,385 $ 6,317 $ 6,037
Gross Margin 1,903 2,182 1,945 1,918
Earnings from Continuing Operations 342 464 336 317
Earnings from Discontinued Operations, Net of Tax 4332
Net Earnings 346 467 339 319
Basic Earnings Per Share – Continuing Operations 0.44 0.59 0.44 0.41
Basic Earnings Per Share – Discontinued Operations 0.01 0.01 – –
Basic Earnings Per Share 0.45 0.60 0.44 0.41
Diluted Earnings Per Share – Continuing Operations 0.43 0.58 0.43 0.40
Diluted Earnings Per Share – Discontinued Operations 0.01 0.01 – –
Diluted Earnings Per Share $ 0.44 $ 0.59 $ 0.43 $ 0.40
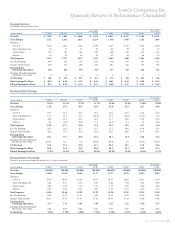
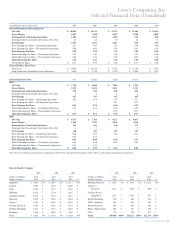
Lowe’s Companies, Inc.
Selected Financial Data (Unaudited)
Sales by Product Category
2003 2002 2001
–––––––––––––––––––––––––––––––––––––––––– –––––––––––––––––––––––––––––––––––––––– –––––––––––––––––––––––––––––––––––––––
(Dollars in Millions) Total Total Total
Product Category Sales % Sales % Sales %
Appliances $ 3,508 11% $ 2,987 11% $ 2,413 11%
Lumber 2,642 9 2,224 9 2,006 9
Paint 2,040 7 1,731 7 1,420 7
Millwork 2,036 7 1,718 7 1,447 7
Outdoor Fashion 2,011 7 1,732 7 1,441 7
Flooring 1,992 6 1,645 6 1,264 6
Nursery 1,935 6 1,651 6 1,401 6
Fashion Electrical 1,850 6 1,581 6 1,310 6
Fashion Plumbing 1,812 6 1,551 6 1,263 6
Hardware 1,746 6 1,485 6 1,246 5
Tools $ 1,691 5% $ 1,474 5% $ 1,264 6%
2003 2002 2001
–––––––––––––––––––––––––––––––––––––––––– –––––––––––––––––––––––––––––––––––––––– –––––––––––––––––––––––––––––––––––––––
(Dollars in Millions) Total Total Total
Product Category Sales % Sales % Sales %
Building Materials $ 1,659 5% $ 1,404 5% $ 1,252 6%
Cabinets /
Furniture 1,233 4 1,028 4 809 4
Outdoor Power
Equipment 1,231 3 1,004 4 817 3
Rough Plumbing 978 3 844 3 704 3
Walls / Windows 844 3 704 3 550 2
Rough Electrical 787 3 681 2 581 3
Home Organization 667 2 527 2 419 2
Other 176 1 141 1 107 1
Totals $30,838 100% $26,112 100% $21,714 100%
Note: The selected financial data has been adjusted to reflect the 26 Contractor Yard locations sold in 2003 as a discontinued operation for all periods.