Lowe's 2015 Annual Report Download - page 24
Download and view the complete annual report
Please find page 24 of the 2015 Lowe's annual report below. You can navigate through the pages in the report by either clicking on the pages listed below, or by using the keyword search tool below to find specific information within the annual report.-
 1
1 -
2
-
3
-
4
-
5
-
6
-
7
-
8
-
9
-
10
-
11
-
12
-
13
-
 14
14 -
 15
15 -
 16
16 -
 17
17 -
 18
18 -
 19
19 -
 20
20 -
 21
21 -
 22
22 -
 23
23 -
 24
24 -
 25
25 -
 26
26 -
 27
27 -
 28
28 -
 29
29 -
 30
30 -
 31
31 -
 32
32 -
 33
33 -
 34
34 -
35
-
36
-
37
-
38
-
39
-
40
-
41
-
42
-
43
-
44
-
45
-
46
-
47
-
48
-
49
-
50
-
51
-
52
-
53
-
54
-
55
-
56
-
57
-
58
-
59
-
60
-
61
-
62
-
63
-
64
-
65
-
66
-
67
-
68
-
69
-
70
-
71
-
72
-
73
-
74
-
75
-
76
-
77
-
78
-
79
-
80
-
81
-
82
-
83
-
84
-
85
-
86
-
87
-
88
-
89
 |
 |

15
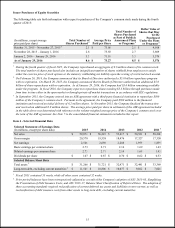
Issuer Purchases of Equity Securities
The following table sets forth information with respect to purchases of the Company’s common stock made during the fourth
quarter of 2015:
(In millions, except average
price paid per share)
Total Number of
Shares Purchased 1
Average Price
Paid per Share
Total Number of
Shares Purchased
as Part of Publicly
Announced Plans
or Programs 2
Dollar Value of
Shares that May
Yet B e
Purchased
Under the Plans
or Programs 2
October 31, 2015 – November 27, 2015 3
2.5
$
73.08
2.5
$
4,018
November 28, 2015 – January 1, 2016
2.8
75.92
2.7
3,809
January 2, 2016 – January 29, 2016
3.3
71.18
3.3
3,576
As of January 29, 2016
8.6
$
73.27
8.5
$
3,576
1 During the fourth quarter of fiscal 2015, the Company repurchased an aggregate of 8.6 million shares of its common stock.
The total number of shares purchased also includes an insignificant number of shares withheld from employees to satisfy
either the exercise price of stock options or the statutory withholding tax liability upon the vesting of restricted stock awards.
2 On February 26, 2014, the Company announced that its Board of Directors authorized a $5.0 billion repurchase program
with no expiration. On March 20, 2015, the Company announced that its Board of Directors authorized an additional $5.0
billion of share repurchases with no expiration. As of January 29, 2016, the Company had $3.6 billion remaining available
under the program. In fiscal 2016, the Company expects to repurchase shares totaling $3.5 billion through purchases made
from time to time either in the open market or through private off market transactions in accordance with SEC regulations.
3 In September 2015, the Company entered into an ASR agreement with a third-party financial institution to repurchase $500
million of the Company’s common stock. Pursuant to the agreement, the Company paid $500 million to the financial
institution and received an initial delivery of 6.2 million shares. In November 2015, the Company finalized the transaction
and received an additional 0.9 million shares. The average price paid per share in settlement of the ASR agreement included
in the table above was determined with reference to the volume-weighted average price of the Company’s common stock over
the term of the ASR agreement. See Note 7 to the consolidated financial statements included in this report.
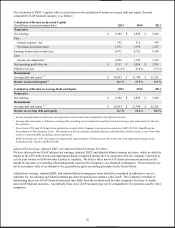
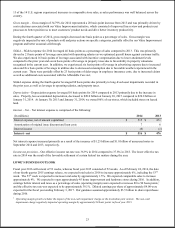
Item 6 - Selected Financial Data
Selected Statement of Earnings Data
(In millions, except per share data)
2015
2014
2013
2012
2011 1
Net sales
$
59,074
$
56,223
$
53,417
$
50,521
$
50,208
Gross margin
20,570
19,558
18,476
17,327
17,350
Net earnings
2,546
2,698
2,286
1,959
1,839
Basic earnings per common share
2.73
2.71
2.14
1.69
1.43
Diluted earnings per common share
2.73
2.71
2.14
1.69
1.43
Dividends per share
$
1.07
$
0.87
$
0.70
$
0.62
$
0.53
Selected Balance Sheet Data
Total assets 2
$
31,266
$
31,721
$
32,471
$
32,441
$
33,369
Long-term debt, excluding current maturities 2
$
11,545
$
10,806
$
10,077
$
9,022
$
7,028
1 Fiscal 2011 contained 53 weeks, while all other years contained 52 weeks.
2 Prior period balances have been retrospectively adjusted as a result of the Company’s adoption of ASU 2015-03, Simplifying
the Presentation of Debt Issuance Costs, and ASU 2015-17, Balance Sheet Classification of Deferred Taxes. The adoption of
these accounting standards required reclassification of current deferred tax assets and liabilities to non-current, as well as
reclassification of debt issuance costs from other assets to long-term debt, excluding current maturities.