Lowe's 2015 Annual Report Download - page 44
Download and view the complete annual report
Please find page 44 of the 2015 Lowe's annual report below. You can navigate through the pages in the report by either clicking on the pages listed below, or by using the keyword search tool below to find specific information within the annual report.-
 1
1 -
2
-
3
-
4
-
5
-
6
-
7
-
8
-
9
-
10
-
11
-
12
-
13
-
14
-
15
-
16
-
17
-
18
-
19
-
20
-
21
-
22
-
23
-
24
-
25
-
26
-
27
-
28
-
29
-
30
-
31
-
32
-
33
-
 34
34 -
 35
35 -
 36
36 -
 37
37 -
 38
38 -
 39
39 -
 40
40 -
 41
41 -
 42
42 -
 43
43 -
 44
44 -
 45
45 -
 46
46 -
 47
47 -
 48
48 -
 49
49 -
 50
50 -
 51
51 -
 52
52 -
 53
53 -
 54
54 -
55
-
56
-
57
-
58
-
59
-
60
-
61
-
62
-
63
-
64
-
65
-
66
-
67
-
68
-
69
-
70
-
71
-
72
-
73
-
74
-
75
-
76
-
77
-
78
-
79
-
80
-
81
-
82
-
83
-
84
-
85
-
86
-
87
-
88
-
89
 |
 |

35
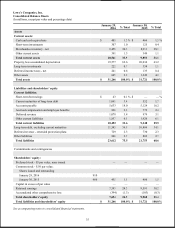
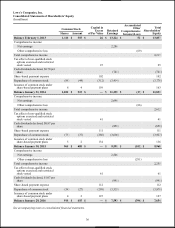
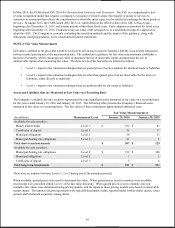
Lowe’s Companies, Inc.
Consolidated Balance Sheets
(In millions, except par value and percentage data)
January 29,
2016
% Total
January 30,
2015
% Total
Assets
Current assets:
Cash and cash equivalents
$
405
1.3
%
$
466
1.5
%
Short-term investments
307
1.0
125
0.4
Merchandise inventory - net
9,458
30.3
8,911
28.1
Other current assets
391
1.3
349
1.1
Total current assets
10,561
33.9
9,851
31.1
Property, less accumulated depreciation
19,577
62.6
20,034
63.2
Long-term investments
222
0.7
354
1.1
Deferred income taxes - net
241
0.8
133
0.4
Other assets
665
2.0
1,349
4.2
Total assets
$
31,266
100.0
%
$
31,721
100.0
%
Liabilities and shareholders’ equity
Current liabilities:
Short-term borrowings
$
43
0.1
%
$
—
—
%
Current maturities of long-term debt
1,061
3.4
552
1.7
Accounts payable
5,633
18.0
5,124
16.2
Accrued compensation and employee benefits
820
2.6
773
2.4
Deferred revenue
1,078
3.4
979
3.1
Other current liabilities
1,857
6.1
1,920
6.1
Total current liabilities
10,492
33.6
9,348
29.5
Long-term debt, excluding current maturities
11,545
36.9
10,806
34.1
Deferred revenue - extended protection plans
729
2.3
730
2.3
Other liabilities
846
2.7
869
2.7
Total liabilities
23,612
75.5
21,753
68.6
Commitments and contingencies
Shareholders’ equity:
Preferred stock - $5 par value, none issued
—
—
—
—
Common stock - $.50 par value;
Shares issued and outstanding
January 29, 2016
910
January 30, 2015
960
455
1.5
480
1.5
Capital in excess of par value
—
—
—
—
Retained earnings
7,593
24.3
9,591
30.2
Accumulated other comprehensive loss
(394
)
(1.3
)
(103
)
(0.3
)
Total shareholders’ equity
7,654
24.5
9,968
31.4
Total liabilities and shareholders’ equity
$
31,266
100.0
%
$
31,721
100.0
%
See accompanying notes to consolidated financial statements.