Lowe's 2015 Annual Report Download - page 61
Download and view the complete annual report
Please find page 61 of the 2015 Lowe's annual report below. You can navigate through the pages in the report by either clicking on the pages listed below, or by using the keyword search tool below to find specific information within the annual report.-
 1
1 -
2
-
3
-
4
-
5
-
6
-
7
-
8
-
9
-
10
-
11
-
12
-
13
-
14
-
15
-
16
-
17
-
18
-
19
-
20
-
21
-
22
-
23
-
24
-
25
-
26
-
27
-
28
-
29
-
30
-
31
-
32
-
33
-
34
-
35
-
36
-
37
-
38
-
39
-
40
-
41
-
42
-
43
-
44
-
45
-
46
-
47
-
48
-
49
-
50
-
 51
51 -
 52
52 -
 53
53 -
 54
54 -
 55
55 -
 56
56 -
 57
57 -
 58
58 -
 59
59 -
 60
60 -
 61
61 -
 62
62 -
 63
63 -
 64
64 -
 65
65 -
 66
66 -
 67
67 -
 68
68 -
 69
69 -
 70
70 -
 71
71 -
72
-
73
-
74
-
75
-
76
-
77
-
78
-
79
-
80
-
81
-
82
-
83
-
84
-
85
-
86
-
87
-
88
-
89
 |
 |

52
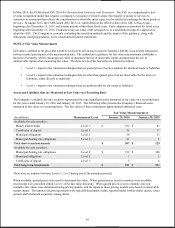
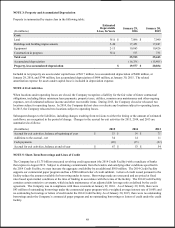
The fair value of each option grant is estimated on the date of grant using the Black-Scholes option-pricing model. When
determining expected volatility, the Company considers the historical volatility of the Company’s stock price, as well as
implied volatility. The risk-free interest rate is based on the U.S. Treasury yield curve in effect at the time of grant, based on
the options’ expected term. The expected term of the options is based on the Company’s evaluation of option holders’ exercise
patterns and represents the period of time that options are expected to remain unexercised. The Company uses historical data to
estimate the timing and amount of forfeitures. The weighted average assumptions used in the Black-Scholes option-pricing
model and weighted-average grant date fair value for options granted in 2015, 2014, and 2013 are as follows:
2015
2014
2013
Weighted-average assumptions used:
Expected volatility
31.3
%
34.2
%
34.2
%
Dividend yield
1.69
%
1.73
%
1.45
%
Risk-free interest rate
1.99
%
2.26
%
1.31
%
Expected term, in years
7.00
7.00
7.39
Weighted-average grant date fair value
$
20.27
$
17.00
$
12.24
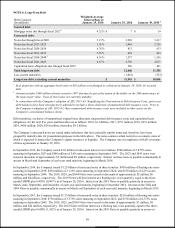
The total intrinsic value of options exercised, representing the difference between the exercise price and the market price on the
date of exercise, was approximately $68 million, $62 million and $48 million in 2015, 2014 and 2013, respectively.
Transactions related to stock options for the year ended January 29, 2016 are summarized as follows:
Shares
(In thousands)
Weighted-
Average
Exercise Price
Per Share
Weighted-
Average
Remaining Term
(In years)
Aggregate
Intrinsic Value
(In thousands)
Outstanding at January 30, 2015
6,311
$
35.98
Granted
862
69.44
Canceled, forfeited or expired
(215
)
54.21
Exercised
(1,527
)
30.26
Outstanding at January 29, 2016
5,431
$
42.18
6.04
$
160,105
Vested and expected to vest at
January 29, 2016
1
5,357
$
41.91
6.00
$
159,387
Exercisable at January 29, 2016
3,200
$
32.88
4.28
$
124,067
1 Includes outstanding vested options as well as outstanding nonvested options after a forfeiture rate is applied.
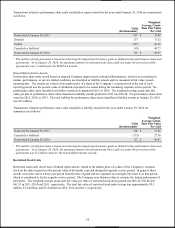
Restricted Stock Awards
Restricted stock awards are valued at the market price of a share of the Company’s common stock on the date of grant. In
general, these awards vest at the end of a three year period from the date of grant and are expensed on a straight-line basis over
that period, which is considered to be the requisite service period. The Company uses historical data to estimate the timing and
amount of forfeitures. The weighted-average grant-date fair value per share of restricted stock awards granted was $69.44,
$53.13 and $41.78 in 2015, 2014, and 2013, respectively. The total fair value of restricted stock awards vesting was
approximately $144 million, $114 million and $98 million in 2015, 2014 and 2013, respectively.