Lowe's 2015 Annual Report Download - page 30
Download and view the complete annual report
Please find page 30 of the 2015 Lowe's annual report below. You can navigate through the pages in the report by either clicking on the pages listed below, or by using the keyword search tool below to find specific information within the annual report.-
 1
1 -
2
-
3
-
4
-
5
-
6
-
7
-
8
-
9
-
10
-
11
-
12
-
13
-
14
-
15
-
16
-
17
-
18
-
19
-
 20
20 -
 21
21 -
 22
22 -
 23
23 -
 24
24 -
 25
25 -
 26
26 -
 27
27 -
 28
28 -
 29
29 -
 30
30 -
 31
31 -
 32
32 -
 33
33 -
 34
34 -
 35
35 -
 36
36 -
 37
37 -
 38
38 -
 39
39 -
 40
40 -
41
-
42
-
43
-
44
-
45
-
46
-
47
-
48
-
49
-
50
-
51
-
52
-
53
-
54
-
55
-
56
-
57
-
58
-
59
-
60
-
61
-
62
-
63
-
64
-
65
-
66
-
67
-
68
-
69
-
70
-
71
-
72
-
73
-
74
-
75
-
76
-
77
-
78
-
79
-
80
-
81
-
82
-
83
-
84
-
85
-
86
-
87
-
88
-
89
 |
 |

21
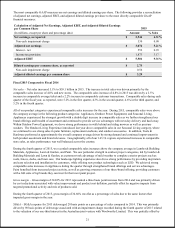
The most comparable GAAP measures are net earnings and diluted earnings per share. The following provides a reconciliation
of adjusted net earnings, adjusted EBIT, and adjusted diluted earnings per share to the most directly comparable GAAP
financial measures:
Calculation of Adjusted Net Earnings, Adjusted EBIT, and Adjusted Diluted Earnings
per Common Share
2015
(In millions, except per share and percentage data)
Amount
% Sales
Net earnings, as reported
$
2,546
4.31
%
Non-cash impairment charge
530
0.90
Adjusted net earnings
$
3,076
5.21
%
Interest - net
552
0.93
Income tax provision
1,873
3.17
Adjusted EBIT
$
5,501
9.31
%
Diluted earnings per common share, as reported
$
2.73
Non-cash impairment charge
0.56
Adjusted diluted earnings per common share
$
3.29
Fiscal 2015 Compared to Fiscal 2014
Net sales – Net sales increased 5.1% to $59.1 billion in 2015. The increase in total sales was driven primarily by the
comparable sales increase of 4.8% and new stores. The comparable sales increase of 4.8% in 2015 was driven by a 2.5%
increase in comparable average ticket and a 2.2% increase in comparable customer transactions. Comparable sales during each
quarter of the fiscal year, as reported, were 5.2% in the first quarter, 4.3% in the second quarter, 4.6% in the third quarter, and
5.2% in the fourth quarter.
All of our product categories experienced comparable sales increases for the year. During 2015, comparable sales were above
the company average in the following product categories: Appliances, Outdoor Power Equipment, and Seasonal Living.
Appliances experienced the strongest growth with a double digit increase in comparable sales as we further strengthened our
brand offerings and breadth of assortment and continued to provide service advantages with next-day delivery and haul away.
Within Outdoor Power Equipment, we drove strong performance in walk behind and riding mowers as well as pressure
washers. The Outdoor Living Experience introduced last year drove comparable sales in our Seasonal Living category, where
we continued to see strong sales in patio furniture, replacement cushions, and outdoor accessories. In addition, Tools &
Hardware performed at approximately the overall company average driven by strong demand and continued improvement in
both product assortment and brand relevance. Geographically, all of our 14 U.S. regions experienced increases in comparable
store sales, as sales performance was well balanced across the country.
During the fourth quarter of 2015, we recorded comparable sales increases above the company average in Lumber & Building
Materials, Appliances, Lawn & Garden, and Paint. We saw particular strength in outdoor project categories, led by Lumber &
Building Materials and Lawn & Garden, as customers took advantage of mild weather to complete exterior projects such as
roofs, fences, decks, and lawn care. Our landscape lighting experience also drove strong performance by providing inspiration
and easy selection and installation for customers, while offering new product technologies such as LED. We achieved strong
comparable sales increases in Appliances during the quarter through strengthened brand offerings and service advantages.
Paint benefited from increased project activity, as well as growing awareness of our three-brand offering, providing customers
with a full suite of top brands they can trust for their next paint project.
Gross margin – Gross margin of 34.82% for 2015 represented a three basis point increase from 2014 and was primarily driven
by cost reductions associated with value improvement and product cost deflation, partially offset by negative impacts from
targeted promotional activity and mix of products sold.
During the fourth quarter of 2015, gross margin of 34.66% was flat as a percentage of sales due to the same factors that
impacted gross margin in the year.
SG&A – SG&A expense for 2015 deleveraged 28 basis points as a percentage of sales compared to 2014. This was primarily
driven by 90 basis points of deleverage associated with an impairment charge recorded during the fourth quarter of 2015 related
to the valuation of our one-third interest in the Australian joint venture with Woolworths Limited. This was partially offset by