Lowe's 2015 Annual Report Download - page 54
Download and view the complete annual report
Please find page 54 of the 2015 Lowe's annual report below. You can navigate through the pages in the report by either clicking on the pages listed below, or by using the keyword search tool below to find specific information within the annual report.-
 1
1 -
2
-
3
-
4
-
5
-
6
-
7
-
8
-
9
-
10
-
11
-
12
-
13
-
14
-
15
-
16
-
17
-
18
-
19
-
20
-
21
-
22
-
23
-
24
-
25
-
26
-
27
-
28
-
29
-
30
-
31
-
32
-
33
-
34
-
35
-
36
-
37
-
38
-
39
-
40
-
41
-
42
-
43
-
 44
44 -
 45
45 -
 46
46 -
 47
47 -
 48
48 -
 49
49 -
 50
50 -
 51
51 -
 52
52 -
 53
53 -
 54
54 -
 55
55 -
 56
56 -
 57
57 -
 58
58 -
 59
59 -
 60
60 -
 61
61 -
 62
62 -
 63
63 -
 64
64 -
65
-
66
-
67
-
68
-
69
-
70
-
71
-
72
-
73
-
74
-
75
-
76
-
77
-
78
-
79
-
80
-
81
-
82
-
83
-
84
-
85
-
86
-
87
-
88
-
89
 |
 |

45
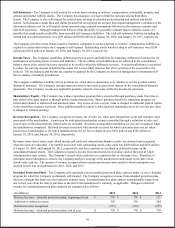
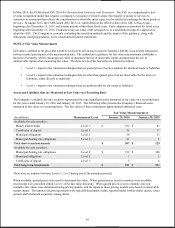
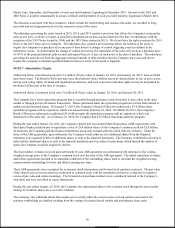
In May 2014, the FASB issued ASU 2014-09, Revenue from Contracts with Customers. The ASU is a comprehensive new
revenue recognition model that requires a company to recognize revenue to depict the transfer of goods or services to
customers in an amount that reflects the consideration to which the entity expects to be entitled in exchange for those goods or
services. In August 2015, the FASB issued ASU 2015-14, which deferred the effective date of the ASU to fiscal years
beginning after December 15, 2017, and interim periods within those fiscal years. Early adoption is permitted for fiscal years
beginning after December 15, 2016. Companies may use either a full retrospective or a modified retrospective approach to
adopt this ASU. The Company is currently evaluating the transition methods and the impact of the guidance, along with
subsequent clarifying guidance, on its consolidated financial statements.
NOTE 2: Fair Value Measurements
Fair value is defined as the price that would be received to sell an asset or paid to transfer a liability in an orderly transaction
between market participants at the measurement date. The authoritative guidance for fair value measurements establishes a
three-level hierarchy, which encourages an entity to maximize the use of observable inputs and minimize the use of
unobservable inputs when measuring fair value. The three levels of the hierarchy are defined as follows:
• Level 1 - inputs to the valuation techniques that are quoted prices in active markets for identical assets or liabilities
• Level 2 - inputs to the valuation techniques that are other than quoted prices but are observable for the assets or
liabilities, either directly or indirectly
• Level 3 - inputs to the valuation techniques that are unobservable for the assets or liabilities
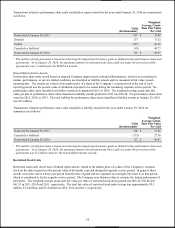
Assets and Liabilities that are Measured at Fair Value on a Recurring Basis
The Company’s available-for-sale securities represented the only significant assets measured at fair value on a recurring basis
for the years ended January 29, 2016 and January 30, 2015. The following table presents the Company’s financial assets
measured at fair value on a recurring basis. The fair values of these instruments approximated amortized costs.
Fair Value Measurements at
(In millions)
Measurement Level
January 29, 2016
January 30, 2015
Available-for-sale securities:
Money market funds
Level 1
$
192
$
81
Certificates of deposit
Level 1
56
17
Municipal obligations
Level 2
38
21
Municipal floating rate obligations
Level 2
21
6
Tota l s h o r t -term investments
$
307
$
125
Available-for-sale securities:
Municipal floating rate obligations
Level 2
$
212
$
348
Municipal obligations
Level 2
5
2
Certificates of deposit
Level 1
5
4
Total long-term investments
$
222
$
354
There were no transfers between Levels 1, 2 or 3 during any of the periods presented.
When available, quoted prices were used to determine fair value. When quoted prices in active markets were available,
investments were classified within Level 1 of the fair value hierarchy. When quoted prices in active markets were not
available, fair values were determined using pricing models, and the inputs to those pricing models were based on observable
market inputs. The inputs to the pricing models were typically benchmark yields, reported trades, broker-dealer quotes, issuer
spreads and benchmark securities, among others.