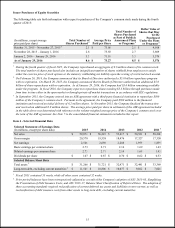
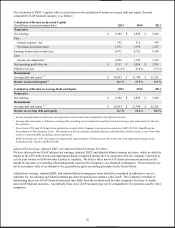
Lowe's 2015 Annual Report Download - page 25
Download and view the complete annual report
Please find page 25 of the 2015 Lowe's annual report below. You can navigate through the pages in the report by either clicking on the pages listed below, or by using the keyword search tool below to find specific information within the annual report.-
 1
1 -
2
-
3
-
4
-
5
-
6
-
7
-
8
-
9
-
10
-
11
-
12
-
13
-
14
-
 15
15 -
 16
16 -
 17
17 -
 18
18 -
 19
19 -
 20
20 -
 21
21 -
 22
22 -
 23
23 -
 24
24 -
 25
25 -
 26
26 -
 27
27 -
 28
28 -
 29
29 -
 30
30 -
 31
31 -
 32
32 -
 33
33 -
 34
34 -
 35
35 -
36
-
37
-
38
-
39
-
40
-
41
-
42
-
43
-
44
-
45
-
46
-
47
-
48
-
49
-
50
-
51
-
52
-
53
-
54
-
55
-
56
-
57
-
58
-
59
-
60
-
61
-
62
-
63
-
64
-
65
-
66
-
67
-
68
-
69
-
70
-
71
-
72
-
73
-
74
-
75
-
76
-
77
-
78
-
79
-
80
-
81
-
82
-
83
-
84
-
85
-
86
-
87
-
88
-
89
 |
 |

16
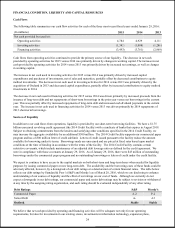
Item 7 - Management’s Discussion and Analysis of Financial Condition and Results of Operations
The following discussion and analysis summarizes the significant factors affecting our consolidated operating results, financial
condition, liquidity and capital resources during the three-year period ended January 29, 2016 (our fiscal years 2015, 2014 and
2013). Unless otherwise noted, all references herein for the years 2015, 2014 and 2013 represent the fiscal years ended
January 29, 2016, January 30, 2015 and January 31, 2014, respectively. We intend for this discussion to provide the reader
with information that will assist in understanding our financial statements, the changes in certain key items in those financial
statements from year to year, and the primary factors that accounted for those changes, as well as how certain accounting
principles affect our financial statements. This discussion should be read in conjunction with our consolidated financial
statements and notes to the consolidated financial statements included in this Annual Report on Form 10-K that have been
prepared in accordance with accounting principles generally accepted in the United States of America. This discussion and
analysis is presented in seven sections:
• Executive Overview
• Operations
• Lowe’s Business Outlook
• Financial Condition, Liquidity and Capital Resources
• Off-Balance Sheet Arrangements
• Contractual Obligations and Commercial Commitments
• Critical Accounting Policies and Estimates
EXECUTIVE OVERVIEW
Net sales for 2015 were $59.1 billion, a 5.1% increase over fiscal year 2014. Comparable sales increased 4.8%, driven by a
comparable average ticket increase of 2.5% and a comparable transaction increase of 2.2%. Net earnings, which were
negatively impacted by an impairment charge discussed below, declined 5.6% to $2.5 billion. Diluted earnings per common
share increased to $2.73 from $2.71 in 2014.
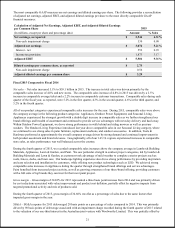
Results for 2015 were negatively impacted by a $530 million non-cash impairment charge associated with our decision to exit
the Australian home improvement market by withdrawing from our joint venture with Woolworths Limited. Excluding the
impact of this charge, adjusted net income totaled $3.1 billion, an increase of 14.0% over 2014, and adjusted diluted earnings
per share increased 21.4% to $3.29 (see discussion on non-GAAP financial measures beginning on page 19).
For 2015, cash flows from operating activities were approximately $4.8 billion, with $1.2 billion used for capital expenditures.
Delivering on our commitment to return excess cash to shareholders, the company repurchased 53.5 million shares of stock
through the share repurchase program for $3.8 billion and paid $957 million in dividends during the year.
Throughout 2015, we remained committed to our key priorities, capitalizing on opportunities within an improving economy
and further pursue top line growth through differentiating ourselves with better customer experiences, improving our product
and service offering for the Pro customer, and driving productivity and profitability. In addition, we continued to enhance our
omni-channel capabilities, providing not just the products, but also the services, information, and advice to help our customers
at every step of the home improvement journey and build a greater affinity for the Lowe’s brand.
Through collaboration between our merchants, stores, and customer experience design team, we leveraged our customer
experience design capabilities as well as our larger store format to showcase the Outdoor Living Experience and the Holiday
Décor Experience which drove strong sales and attachment for products during the year. To help customers envision and create
their outdoor spaces for spring, we displayed patio sets with coordinating rugs, umbrellas, and accessories, along with grills and
other outdoor products just as they would have expected in their own backyard. This space was re-purposed for the Holiday
Décor Experience in the second half of the year which inspired customers to decorate, raised awareness of the breadth of
holiday décor and gift offerings, and provided project solutions relevant to the holiday micro seasons. By providing an
integrative and cohesive assortment of products, inspiring and intuitive presentation and display, and optimal service
components across all selling channels, we are able to provide better customer experiences that differentiate us in the
marketplace.
We remained committed to building on our strong foundation with the Pro customer by continuing to advance our product and
service offerings to meet their unique needs. Throughout the year, we have strengthened our portfolio of Pro-focused brands
with the addition of both national and local brands. In addition, our re-launch of LowesForPros.com in the first half of the year
provides the Pro customer with an easy online ordering experience with their choice of in-store pick-up or delivery, saving the
Pro time and money. The site makes it easy for Pros to manage multiple properties and easily purchase items for their locations