Lowe's 2015 Annual Report Download - page 43
Download and view the complete annual report
Please find page 43 of the 2015 Lowe's annual report below. You can navigate through the pages in the report by either clicking on the pages listed below, or by using the keyword search tool below to find specific information within the annual report.-
 1
1 -
2
-
3
-
4
-
5
-
6
-
7
-
8
-
9
-
10
-
11
-
12
-
13
-
14
-
15
-
16
-
17
-
18
-
19
-
20
-
21
-
22
-
23
-
24
-
25
-
26
-
27
-
28
-
29
-
30
-
31
-
32
-
 33
33 -
 34
34 -
 35
35 -
 36
36 -
 37
37 -
 38
38 -
 39
39 -
 40
40 -
 41
41 -
 42
42 -
 43
43 -
 44
44 -
 45
45 -
 46
46 -
 47
47 -
 48
48 -
 49
49 -
 50
50 -
 51
51 -
 52
52 -
 53
53 -
54
-
55
-
56
-
57
-
58
-
59
-
60
-
61
-
62
-
63
-
64
-
65
-
66
-
67
-
68
-
69
-
70
-
71
-
72
-
73
-
74
-
75
-
76
-
77
-
78
-
79
-
80
-
81
-
82
-
83
-
84
-
85
-
86
-
87
-
88
-
89
 |
 |

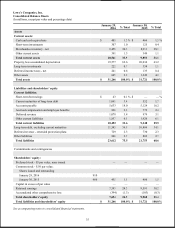
34
Lowe’s Companies, Inc.
Consolidated Statements of Earnings
(In millions, except per share and percentage data)
January 29,
2016
% Sales
January 30,
2015
% Sales
January 31,
2014
% Sales
Fiscal years ended on
Net sales
$
59,074
100.00
%
$
56,223
100.00
%
$
53,417
100.00
%
Cost of sales
38,504
65.18
36,665
65.21
34,941
65.41
Gross margin
20,570
34.82
19,558
34.79
18,476
34.59
Expenses:
Selling, general and administrative
14,115
23.90
13,281
23.62
12,865
24.08
Depreciation
1,484
2.51
1,485
2.64
1,462
2.74
Interest - net
552
0.93
516
0.92
476
0.89
Total expenses
16,151
27.34
15,282
27.18
14,803
27.71
Pre-tax earnings
4,419
7.48
4,276
7.61
3,673
6.88
Income tax provision
1,873
3.17
1,578
2.81
1,387
2.60
Net earnings
$
2,546
4.31
%
$
2,698
4.80
%
$
2,286
4.28
%
Basic earnings per common share
$
2.73
$
2.71
$
2.14
Diluted earnings per common share
$
2.73
$
2.71
$
2.14
Cash dividends per share
$
1.07
$
0.87
$
0.70
Lowe’s Companies, Inc.
Consolidated Statements of Comprehensive Income
(In millions, except percentage data)
January 29,
2016
% Sales
January 30,
2015
% Sales
January 31,
2014
% Sales
Fiscal years ended on
Net earnings
$
2,546
4.31
%
$
2,698
4.80
%
$
2,286
4.28
%
Foreign currency translation adjustments -
net of tax
(291
)
(0.49
)
(86
)
(0.15
)
(68
)
(0.13
)
Net unrealized investment losses - net of tax
—
—
—
—
(1
)
—
Other comprehensive loss
(291
)
(0.49
)
(86
)
(0.15
)
(69
)
(0.13
)
Comprehensive income
$
2,255
3.82
%
$
2,612
4.65
%
$
2,217
4.15
%
See accompanying notes to consolidated financial statements.