Lowe's 2015 Annual Report Download - page 33
Download and view the complete annual report
Please find page 33 of the 2015 Lowe's annual report below. You can navigate through the pages in the report by either clicking on the pages listed below, or by using the keyword search tool below to find specific information within the annual report.-
 1
1 -
2
-
3
-
4
-
5
-
6
-
7
-
8
-
9
-
10
-
11
-
12
-
13
-
14
-
15
-
16
-
17
-
18
-
19
-
20
-
21
-
22
-
 23
23 -
 24
24 -
 25
25 -
 26
26 -
 27
27 -
 28
28 -
 29
29 -
 30
30 -
 31
31 -
 32
32 -
 33
33 -
 34
34 -
 35
35 -
 36
36 -
 37
37 -
 38
38 -
 39
39 -
 40
40 -
 41
41 -
 42
42 -
 43
43 -
44
-
45
-
46
-
47
-
48
-
49
-
50
-
51
-
52
-
53
-
54
-
55
-
56
-
57
-
58
-
59
-
60
-
61
-
62
-
63
-
64
-
65
-
66
-
67
-
68
-
69
-
70
-
71
-
72
-
73
-
74
-
75
-
76
-
77
-
78
-
79
-
80
-
81
-
82
-
83
-
84
-
85
-
86
-
87
-
88
-
89
 |
 |

24
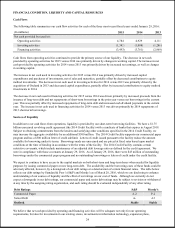
FINANCIAL CONDITION, LIQUIDITY AND CAPITAL RESOURCES
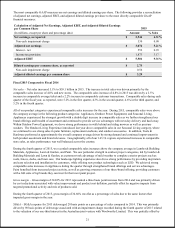
Cash Flows
The following table summarizes our cash flow activities for each of the three most recent fiscal years ended January 29, 2016:
(In millions)
2015
2014
2013
Net cash provided by (used in):
Operating activities
4,784
4,929
4,111
Investing activities
(1,343
)
(1,088
)
(1,286
)
Financing activities
(3,493
)
(3,761
)
(2,969
)
Cash flows from operating activities continued to provide the primary source of our liquidity. The decrease in net cash
provided by operating activities for 2015 versus 2014 was primarily driven by changes in working capital. The increase in net
cash provided by operating activities for 2014 versus 2013 was primarily driven by increased net earnings, as well as changes
in working capital.
The increase in net cash used in investing activities for 2015 versus 2014 was primarily driven by increased capital
expenditures and purchases of investments, net of sales and maturities, partially offset by decreased contributions to equity
method investments. The decrease in net cash used in investing activities for 2014 versus 2013 was primarily driven by the
acquisition of Orchard in 2013 and decreased capital expenditures, partially offset by increased contributions to equity method
investments in 2014.
The decrease in net cash used in financing activities for 2015 versus 2014 was driven primarily by increased proceeds from the
issuance of long-term debt and net repayments of short-term borrowings in the prior year versus net borrowings in the current
year. This was partially offset by increased repayments of long-term debt and increased cash dividend payments in the current
year. The increase in net cash used in financing activities for 2014 versus 2013 was driven primarily by 2014 repayments of
2013 short-term borrowings.
Sources of Liquidity
In addition to our cash flows from operations, liquidity is provided by our short-term borrowing facilities. We have a $1.75
billion unsecured revolving credit agreement (the 2014 Credit Facility) with a syndicate of banks that expires in August 2019.
Subject to obtaining commitments from the lenders and satisfying other conditions specified in the 2014 Credit Facility, we
may increase the aggregate availability by an additional $500 million. The 2014 Credit Facility supports our commercial paper
program and has a $500 million letter of credit sublimit. Letters of credit issued pursuant to the facility reduce the amount
available for borrowing under its terms. Borrowings made are unsecured and are priced at fixed rates based upon market
conditions at the time of funding in accordance with the terms of the facility. The 2014 Credit Facility contains certain
restrictive covenants, which include maintenance of an adjusted debt leverage ratio as defined by the credit agreement. We
were in compliance with those covenants at January 29, 2016. As of January 29, 2016, there were $43 million of outstanding
borrowings under the commercial paper program and no outstanding borrowings or letters of credit under the credit facility.
We expect to continue to have access to the capital markets on both short-term and long-term bases when needed for liquidity
purposes by issuing commercial paper or new long-term debt. The availability and the borrowing costs of these funds could be
adversely affected, however, by a downgrade of our debt ratings or a deterioration of certain financial ratios. The table below
reflects our debt ratings by Standard & Poor’s (S&P) and Moody’s as of March 28, 2016, which we are disclosing to enhance
understanding of our sources of liquidity and the effect of our ratings on our cost of funds. Although we currently do not
expect a downgrade in our debt ratings, our commercial paper and senior debt ratings may be subject to revision or withdrawal
at any time by the assigning rating organization, and each rating should be evaluated independently of any other rating.
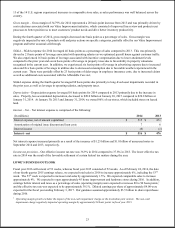
Debt Ratings
S&P
Moody’s
Commercial Paper
A-2
P-2
Senior Debt
A-
A3
Outlook
Stable
Stable
We believe that net cash provided by operating and financing activities will be adequate not only for our operating
requirements, but also for investments in our existing stores, investments in information technology, expansion plans,