Lowe's 2015 Annual Report Download - page 31
Download and view the complete annual report
Please find page 31 of the 2015 Lowe's annual report below. You can navigate through the pages in the report by either clicking on the pages listed below, or by using the keyword search tool below to find specific information within the annual report.-
 1
1 -
2
-
3
-
4
-
5
-
6
-
7
-
8
-
9
-
10
-
11
-
12
-
13
-
14
-
15
-
16
-
17
-
18
-
19
-
20
-
 21
21 -
 22
22 -
 23
23 -
 24
24 -
 25
25 -
 26
26 -
 27
27 -
 28
28 -
 29
29 -
 30
30 -
 31
31 -
 32
32 -
 33
33 -
 34
34 -
 35
35 -
 36
36 -
 37
37 -
 38
38 -
 39
39 -
 40
40 -
 41
41 -
42
-
43
-
44
-
45
-
46
-
47
-
48
-
49
-
50
-
51
-
52
-
53
-
54
-
55
-
56
-
57
-
58
-
59
-
60
-
61
-
62
-
63
-
64
-
65
-
66
-
67
-
68
-
69
-
70
-
71
-
72
-
73
-
74
-
75
-
76
-
77
-
78
-
79
-
80
-
81
-
82
-
83
-
84
-
85
-
86
-
87
-
88
-
89
 |
 |

22
16 basis points of leverage associated with operating salaries as we optimized payroll hours against customer traffic and 16
basis points of leverage in advertising expense due to more efficient and effective media mix compared to the prior year. We
experienced eight basis points of leverage in employee insurance costs due to increased sales in the current year partially offset
by additional costs associated with the Affordable Care Act. We also experienced eight basis points of leverage in utilities due
to stronger sales as well as a decrease in rates and consumption. In addition, we experienced seven basis points of leverage in
building and site repair due to a decrease in the number of repairs during the year and seven basis points of leverage in external
labor due to completed projects and increased focus on use of internal resources across information technology projects.
During the fourth quarter of 2015, SG&A expense deleveraged 332 basis points as a percentage of sales due primarily to 401
basis points of deleverage associated with the Australian joint venture impairment charge partially offset by leverage in
operating salaries, advertising expense, utilities, employee insurance, and certain other fixed costs. We experienced 25 basis
points of leverage in operating salaries associated with optimization of store payroll hours and 20 basis points in advertising
expense due to more efficient and effective media mix. We also experienced 12 basis points of leverage in utilities primarily
the result of warmer weather and 12 basis points in employee insurance costs due to a reduction in the number and severity of
claims. Certain other fixed costs also leveraged as a result of sales growth.
Depreciation – Depreciation expense leveraged 13 basis points for 2015 compared to 2014 primarily due to the increase in
sales. Property, less accumulated depreciation, decreased to $19.6 billion at January 29, 2016 compared to $20.0 billion at
January 30, 2015. At January 29, 2016 and January 30, 2015, we owned 86% of our stores, which included stores on leased
land.
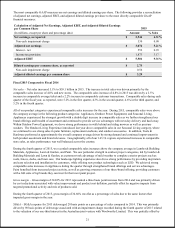
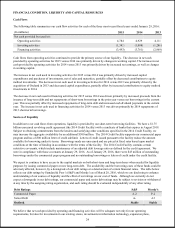
Interest – Net – Net interest expense is comprised of the following:
(In millions)
2015
2014
Interest expense, net of amount capitalized
$
548
$
515
Amortization of original issue discount and loan costs
8
7
Interest income
(4
)
(6
)
Interest - net
$
552
$
516
Net interest expense increased primarily as a result of the issuance of $1.75 billion and $1.25 billion of unsecured notes in
September 2015 and 2014, respectively. This was partially offset by the repayment of $500 million unsecured notes on October
15, 2015.
Income tax provision - Our effective income tax rate was 42.4% in 2015 compared to 36.9% in 2014. During 2015, the
Company recorded a deferred tax asset related to losses associated with the joint venture investment in Australia with
Woolworths Limited. The deferred tax asset associated with these losses was offset with the establishment of a full valuation
allowance due to the fact the benefit of these losses can only be realized to the extent the Company has available capital gains
for offset, and no present or future capital gains have been identified through which this deferred tax asset can be realized.
Excluding the equity losses and related deferred tax asset would have resulted in an effective income tax rate of 38.2%. The
effective tax rate in 2014 benefited from the favorable settlement of certain federal tax matters.
Fiscal 2014 Compared to Fiscal 2013
Net sales – Net sales increased 5.3% to $56.2 billion in 2014. The increase in total sales was driven primarily by the
comparable sales increase of 4.3%, the acquisition of Orchard, and new stores. The comparable sales increase of 4.3% in 2014
was driven by a 2.4% increase in comparable average ticket and a 1.8% increase in comparable customer transactions.
Comparable sales increased during each quarter of the fiscal year as we reported 0.9% in the first quarter, 4.4% in the second
quarter, 5.1% in the third quarter, and 7.3% in the fourth quarter.
All of our product categories experienced comparable sales increases for the year. During 2014, we experienced comparable
sales above the company average in the following product categories: Appliances, Millwork, Tools & Hardware,
Fashion Fixtures, and Outdoor Power Equipment. Targeted promotions coupled with the expansion of our Project Specialist
programs drove comparable sales increases, especially within Appliances, Millwork, and Fashion Fixtures, as we continued to
benefit from customers’ increasing interest in refreshing both the interior and exterior of their homes. Within Tools &
Hardware, our enhanced Sales & Operations Planning process helped us drive strong performance in power and pneumatic
tools. We drove comparable sales within Outdoor Power Equipment as we were prepared to meet strong demand for mowers,
trimmers, and snow blowers. In addition, Flooring performed at approximately the overall company average. Geographically,