Lowe's 2015 Annual Report Download - page 6
Download and view the complete annual report
Please find page 6 of the 2015 Lowe's annual report below. You can navigate through the pages in the report by either clicking on the pages listed below, or by using the keyword search tool below to find specific information within the annual report.-
 1
1 -
 2
2 -
 3
3 -
 4
4 -
 5
5 -
 6
6 -
 7
7 -
 8
8 -
 9
9 -
 10
10 -
 11
11 -
 12
12 -
 13
13 -
 14
14 -
 15
15 -
 16
16 -
 17
17 -
18
-
19
-
20
-
21
-
22
-
23
-
24
-
25
-
26
-
27
-
28
-
29
-
30
-
31
-
32
-
33
-
34
-
35
-
36
-
37
-
38
-
39
-
40
-
41
-
42
-
43
-
44
-
45
-
46
-
47
-
48
-
49
-
50
-
51
-
52
-
53
-
54
-
55
-
56
-
57
-
58
-
59
-
60
-
61
-
62
-
63
-
64
-
65
-
66
-
67
-
68
-
69
-
70
-
71
-
72
-
73
-
74
-
75
-
76
-
77
-
78
-
79
-
80
-
81
-
82
-
83
-
84
-
85
-
86
-
87
-
88
-
89
 |
 |
4
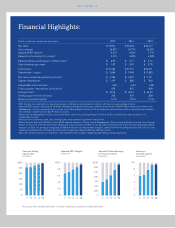
Dollars in millions, except per share data 2015 2014 2013
Net sales $ 59,074 $ 56,223 $ 53,417
Gross margin 34.82% 34.79% 34.59%
Adjusted EBIT margin
1,2
9.31% 8.53% 7.77%
Adjusted net earnings (% to sales)
2
5.21% 4.80% 4.28%
Adjusted diluted earnings per common share
2
$ 3.29 $ 2.71 $ 2.14
Cash dividends per share $ 1.07 $ 0.87 $ 0.70
Total assets $ 31,266 $ 31,721 $ 32,471
Shareholders’ equity $ 7,654 $ 9,968 $ 11,853
Net cash provided by operating activities $ 4,784 $ 4,929 $ 4,111
Capital expenditures $ 1,197 $ 880 $ 940
Comparable sales increase
3
4.8% 4.3% 4.8%
Total customer transactions (in millions) 878 857 828
Average ticket
4
$ 67.26 $ 65.61 $ 64.52
Selling square feet (in millions) 202 201 200
Return on invested capital
5
14.1% 13.9% 11.5%
1 EBIT margin, also referred to as operating margin, is defined as earnings before interest and taxes as a percentage of sales.
2 Adjusted EBIT margin, Adjusted net earnings and Adjusted diluted earnings per common share are non-GAAP financial measures. Refer to the
Management’s Discussion and Analysis section of our Annual Report of Form 10-K for additional information as well as reconciliations between
the Company’s GAAP and non-GAAP financial results.
3 Please see the Management’s Discussion and Analysis section of our Annual Report on Form 10-K for the definition and calculation of a
comparable location.
4 Average ticket is defined as net sales divided by the total number of customer transactions.
5 Return on invested capital (ROIC) is a non-GAAP financial measure. Please see the Management’s Discussion and Analysis section of our Annual
Report on Form 10-K for the definition of ROIC and a reconciliation of ROIC for the periods presented to the most directly comparable GAAP
measure. In 2015, the Company recognized a $530 million non-cash impairment charge in connection with the Company’s decision to exit its joint
venture with Woolworths Limited in Australia, which negatively impacted ROIC by 238 basis points.
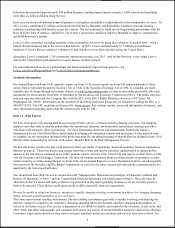
6 Sales per selling square foot is defined as sales divided by the average of beginning and ending selling square feet.
Financial Highlights:
LOWE’S COMPANIES, INC.
Sales per Selling
Square Foot6
(in dollars)
’15
’14’13
’12’11
0
50
100
150
200
250
$300
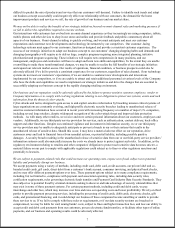
Adjusted EBIT Margin1, 2
(in percent)
0
2.0
4.0
6.0
8.0
10.0%
’12 ’15
’14’13
’11
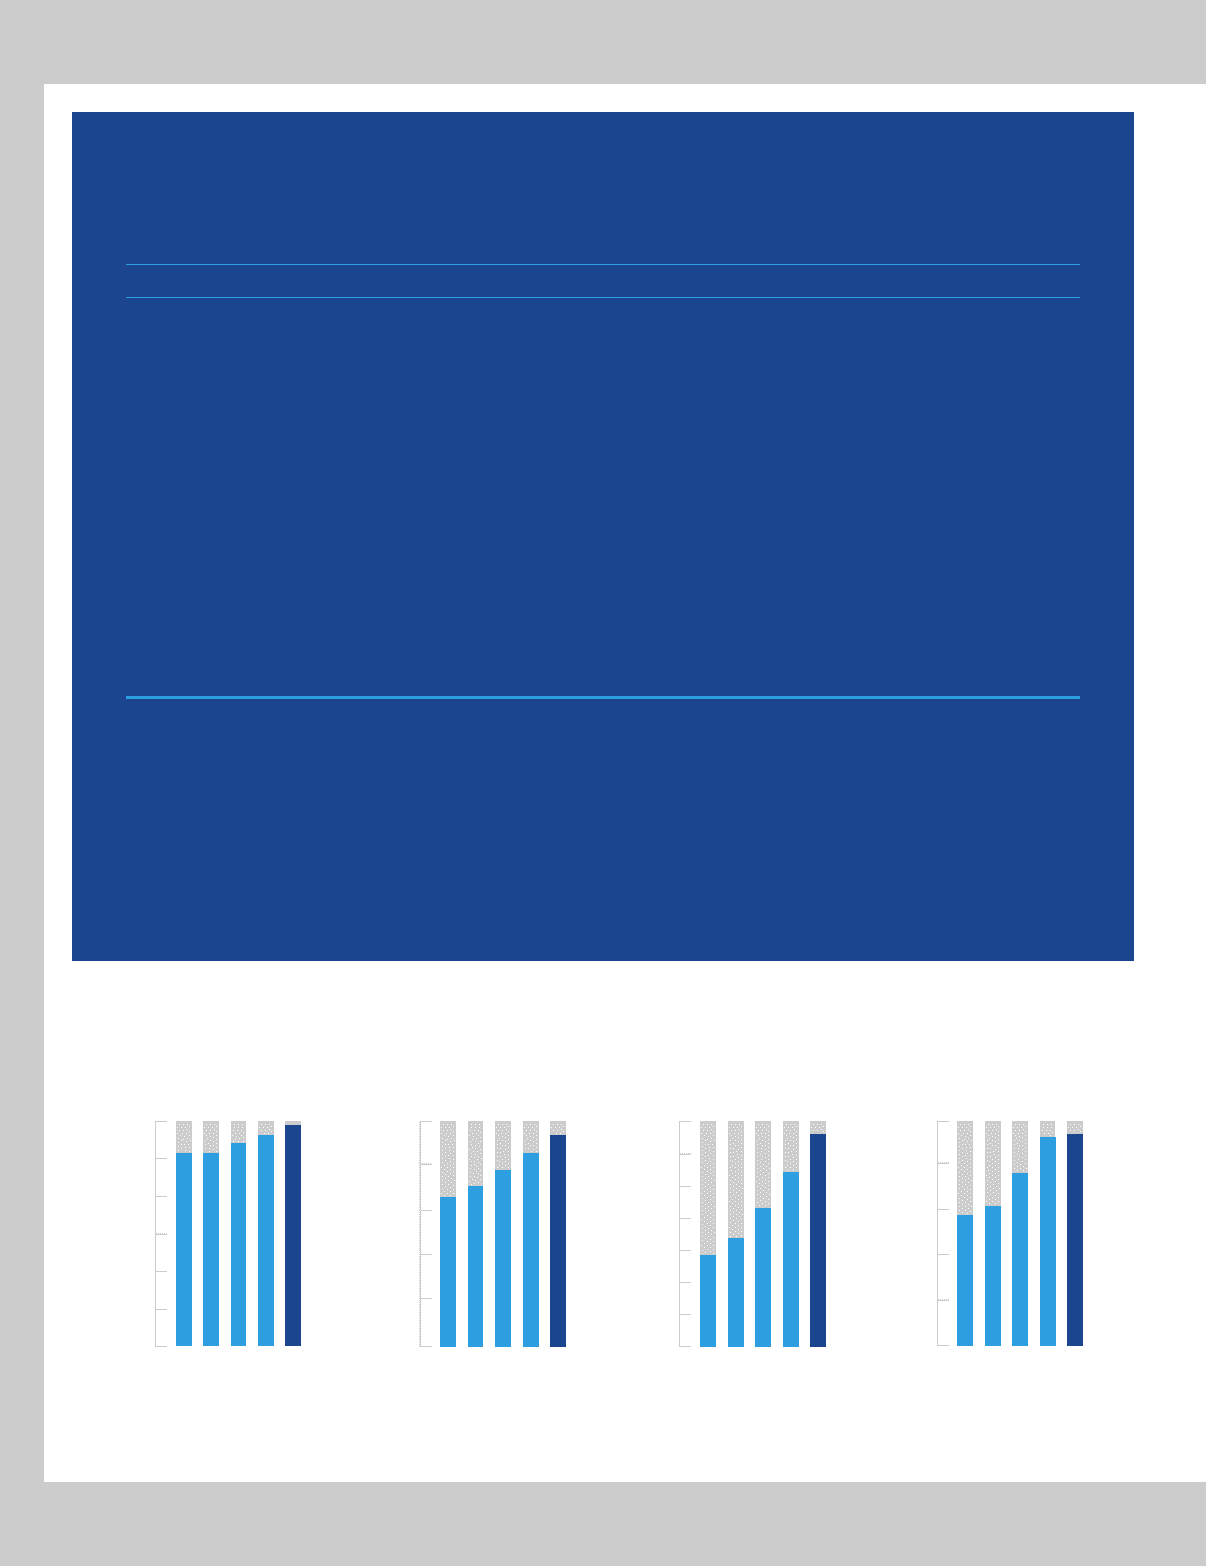
0
0.50
1.00
2.00
2.50
$3.50
3.00
Adjusted Diluted Earnings
per Common Share2
(in dollars)
1.50
’12 ’15
’14’13
’11
0
3
6
9
12
15%
Return on
Invested Capital5
(in percent)
’12
’15
’14’13
’11
Fiscal year 2011 contained 53 weeks. All other fiscal years presented contained 52 weeks.