Lowe's 2015 Annual Report Download - page 29
Download and view the complete annual report
Please find page 29 of the 2015 Lowe's annual report below. You can navigate through the pages in the report by either clicking on the pages listed below, or by using the keyword search tool below to find specific information within the annual report.-
 1
1 -
2
-
3
-
4
-
5
-
6
-
7
-
8
-
9
-
10
-
11
-
12
-
13
-
14
-
15
-
16
-
17
-
18
-
 19
19 -
 20
20 -
 21
21 -
 22
22 -
 23
23 -
 24
24 -
 25
25 -
 26
26 -
 27
27 -
 28
28 -
 29
29 -
 30
30 -
 31
31 -
 32
32 -
 33
33 -
 34
34 -
 35
35 -
 36
36 -
 37
37 -
 38
38 -
 39
39 -
40
-
41
-
42
-
43
-
44
-
45
-
46
-
47
-
48
-
49
-
50
-
51
-
52
-
53
-
54
-
55
-
56
-
57
-
58
-
59
-
60
-
61
-
62
-
63
-
64
-
65
-
66
-
67
-
68
-
69
-
70
-
71
-
72
-
73
-
74
-
75
-
76
-
77
-
78
-
79
-
80
-
81
-
82
-
83
-
84
-
85
-
86
-
87
-
88
-
89
 |
 |

20
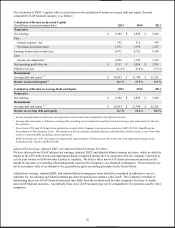
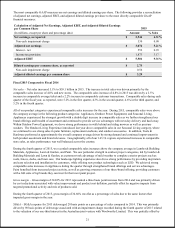
The calculation of ROIC, together with a reconciliation to the calculation of return on average debt and equity, the most
comparable GAAP financial measure, is as follows:
Calculation of Return on Invested Capital
(In millions, except percentage data)
2015
2014
2013
Numerator
Net earnings
$
2,546
$
2,698
$
2,286
Plus:
Interest expense - net
552
516
476
Provision for income taxes
1,873
1,578
1,387
Earnings before interest and taxes
4,971
4,792
4,149
Less:
Income tax adjustment 1
2,058
1,769
1,567
Net operating profit after tax
$
2,913
$
3,024
$
2,581
Effective tax rate
42.4
%
36.9
%
37.8
%
Denominator
Average debt and equity 2, 3
$
20,693
$
21,744
$
22,501
Return on invested capital 4
14.1
%
13.9
%
11.5
%
Calculation of Return on Average Debt and Equity
2015
2014
2013
Numerator
Net earnings
$
2,546
$
2,698
$
2,286
Denominator
Average debt and equity 2, 3
$
20,693
$
21,744
$
22,501
Return on average debt and equity
12.3
%
12.4
%
10.2
%
1 Income tax adjustment is defined as earnings before interest and taxes multiplied by the effective tax rate.
2 Average debt and equity is defined as average debt, including current maturities and short-term borrowings, plus total equity for the last
five quarters.
3 Fiscal years 2014 and 2013 have been adjusted as a result of the Company’s retrospective adoption of ASU 2015-03, Simplifying the
Presentation of Debt Issuance Costs. The adoption of this accounting standard required reclassification of debt issuance costs from other
assets to long-term debt, excluding current maturities.
4 ROIC for fiscal year 2015 was negatively impacted by approximately 238 basis points due to the non-cash impairment charge on the
Australian joint venture with Woolworths.
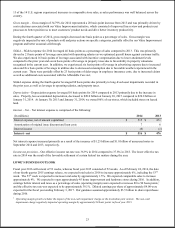
Adjusted Net Earnings, Adjusted EBIT, and Adjusted Diluted Earnings Per Share
We have disclosed non-GAAP adjusted net earnings, adjusted EBIT, and adjusted diluted earnings per share, which exclude the
impact of the $530 million non-cash impairment charge recognized during 2015 in connection with the Company’s decision to
exit its joint venture with Woolworths Limited in Australia. We believe these non-GAAP financial measures provide useful
insight for investors in evaluating what management considers the Company's core financial performance. These measures are
not in accordance with, or an alternative for, generally accepted accounting principles in the United States.
Adjusted net earnings, adjusted EBIT, and adjusted diluted earnings per share should be considered in addition to, not as a
substitute for, net earnings and diluted earnings per share prepared in accordance with GAAP. The Company’s methods of
determining these non-GAAP financial measures may differ from the methods used by other companies for these or similar
non-GAAP financial measures. Accordingly, these non-GAAP measures may not be comparable to the measures used by other
companies.