McDonalds 2015 Annual Report Download - page 14
Download and view the complete annual report
Please find page 14 of the 2015 McDonalds annual report below. You can navigate through the pages in the report by either clicking on the pages listed below, or by using the keyword search tool below to find specific information within the annual report.-
 1
1 -
2
-
3
-
 4
4 -
 5
5 -
 6
6 -
 7
7 -
 8
8 -
 9
9 -
 10
10 -
 11
11 -
 12
12 -
 13
13 -
 14
14 -
 15
15 -
 16
16 -
 17
17 -
 18
18 -
 19
19 -
 20
20 -
 21
21 -
 22
22 -
 23
23 -
 24
24 -
25
-
26
-
27
-
28
-
29
-
30
-
31
-
32
-
33
-
34
-
35
-
36
-
37
-
38
-
39
-
40
-
41
-
42
-
43
-
44
-
45
-
46
-
47
-
48
-
49
-
50
-
51
-
52
-
53
-
54
-
55
-
56
-
57
-
58
-
59
-
60
 |
 |

12 McDonald's Corporation 2015 Annual Report
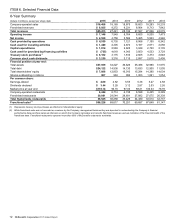
ITEM 6. Selected Financial Data
6-Year Summary
Dollars in millions, except per share data 2015 2014 2013 2012 2011 2010
Company-operated sales $16,488 18,169 18,875 18,603 18,293 16,233
Franchised revenues $ 8,925 9,272 9,231 8,964 8,713 7,842
Total revenues $25,413 27,441 28,106 27,567 27,006 24,075
Operating income $ 7,146 7,949 8,764 8,605 8,530 7,473
Net income $ 4,529 4,758 5,586 5,465 5,503 4,946
Cash provided by operations $ 6,539 6,730 7,121 6,966 7,150 6,342
Cash used for investing activities $ 1,420 2,305 2,674 3,167 2,571 2,056
Capital expenditures $ 1,814 2,583 2,825 3,049 2,730 2,135
Cash used for (provided by) financing activities $ (735) 4,618 4,043 3,850 4,533 3,729
Treasury stock purchases(1) $ 6,182 3,175 1,810 2,605 3,373 2,648
Common stock cash dividends $ 3,230 3,216 3,115 2,897 2,610 2,408
Financial position at year end:
Total assets $37,939 34,227 36,626 35,386 32,990 31,975
Total debt $24,122 14,936 14,130 13,633 12,500 11,505
Total shareholders’ equity $ 7,088 12,853 16,010 15,294 14,390 14,634
Shares outstanding in millions 907 963 990 1,003 1,021 1,054
Per common share:
Earnings-diluted $4.80 4.82 5.55 5.36 5.27 4.58
Dividends declared $3.44 3.28 3.12 2.87 2.53 2.26
Market price at year end $118.14 93.70 97.03 88.21 100.33 76.76
Company-operated restaurants 6,444 6,714 6,738 6,598 6,435 6,399
Franchised restaurants 30,081 29,544 28,691 27,882 27,075 26,338
Total Systemwide restaurants 36,525 36,258 35,429 34,480 33,510 32,737
Franchised sales(2) $66,226 69,617 70,251 69,687 67,648 61,147
(1) Represents treasury stock purchases as reflected in Shareholders' equity.
(2) While franchised sales are not recorded as revenues by the Company, management believes they are important in understanding the Company's financial
performance because these sales are the basis on which the Company calculates and records franchised revenues and are indicative of the financial health of the
franchisee base. Franchised restaurants represent more than 80% of McDonald's restaurants worldwide.