McDonalds 2015 Annual Report Download - page 46
Download and view the complete annual report
Please find page 46 of the 2015 McDonalds annual report below. You can navigate through the pages in the report by either clicking on the pages listed below, or by using the keyword search tool below to find specific information within the annual report.-
 1
1 -
2
-
3
-
4
-
5
-
6
-
7
-
8
-
9
-
10
-
11
-
12
-
13
-
14
-
15
-
16
-
17
-
18
-
19
-
20
-
21
-
22
-
23
-
24
-
25
-
26
-
27
-
28
-
29
-
30
-
31
-
32
-
33
-
34
-
35
-
 36
36 -
 37
37 -
 38
38 -
 39
39 -
 40
40 -
 41
41 -
 42
42 -
 43
43 -
 44
44 -
 45
45 -
 46
46 -
 47
47 -
 48
48 -
 49
49 -
 50
50 -
 51
51 -
 52
52 -
 53
53 -
 54
54 -
 55
55 -
 56
56 -
57
-
58
-
59
-
60
 |
 |

44 McDonald's Corporation 2015 Annual Report
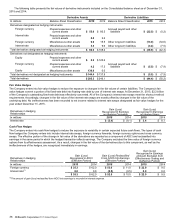
Segment and Geographic Information
The Company franchises and operates McDonald’s restaurants in
the global restaurant industry. In connection with the Company's
announcement in early May 2015 to restructure its global
business, the Company changed its reporting segments, effective
July 1, 2015, from a geographic focus to segments each of which
combines markets with similar characteristics and opportunities for
growth. The following new reporting segments reflect how
management now reviews and evaluates operating performance:
• U.S. - the Company’s largest segment. This segment did
not change as a result of the new reporting structure.
• International Lead Markets - established markets
including Australia, Canada, France, Germany, the U.K.
and related markets.
• High Growth Markets - markets the Company believes
have relatively higher restaurant expansion and
franchising potential including China, Italy, Korea, Poland,
Russia, Spain, Switzerland, the Netherlands and related
markets.
• Foundational Markets and Corporate - the remaining
markets in the McDonald’s system, each of which the
Company believes has the potential to operate under a
largely franchised model. Corporate activities are also
reported within this segment.
The segment information included herein is presented in
accordance with the change in reporting structure for all periods
presented.
All intercompany revenues and expenses are eliminated in
computing revenues and operating income. Corporate general and
administrative expenses consists of home office support costs in
areas such as facilities, finance, human resources, information
technology, legal, marketing, restaurant operations, supply chain
and training. Corporate assets include corporate cash and
equivalents, asset portions of financial instruments and home
office facilities.
In millions 2015 2014 2013
U.S. $ 8,558.9 $ 8,651.0 $ 8,851.3
International Lead Markets 7,614.9 8,544.5 8,535.3
High Growth Markets 6,172.8 6,845.2 7,043.2
Foundational Markets &
Corporate 3,066.4 3,400.6 3,675.9
Total revenues $25,413.0 $27,441.3 $28,105.7
U.S. $ 3,612.0 $ 3,522.5 $ 3,779.3
International Lead Markets 2,712.6 3,034.5 3,028.8
High Growth Markets 841.1 933.9 1,250.0
Foundational Markets &
Corporate (20.2) 458.3 706.2
Total operating income $ 7,145.5 $ 7,949.2 $ 8,764.3
U.S. $11,806.1 $11,872.1 $11,711.8
International Lead Markets 11,136.3 12,538.4 14,815.5
High Growth Markets 5,248.6 5,866.0 6,335.5
Foundational Markets &
Corporate 9,747.7 3,950.9 3,763.5
Total assets $37,938.7 $ 34,227.4 $ 36,626.3
U.S. $533.2$736.1$875.5
International Lead Markets 596.1 792.1 793.3
High Growth Markets 540.5 804.8 831.1
Foundational Markets &
Corporate 144.1 250.4 324.8
Total capital
expenditures $ 1,813.9 $ 2,583.4 $ 2,824.7
U.S. $515.2$ 512.2 $ 503.6
International Lead Markets 460.9 521.2 507.4
High Growth Markets 363.9 387.8 357.3
Foundational Markets &
Corporate 215.7 223.3 216.8
Total depreciation and
amortization $ 1,555.7 $ 1,644.5 $ 1,585.1
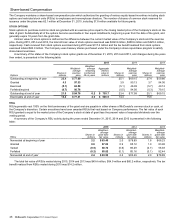
Total long-lived assets, primarily property and equipment,
were (in millions)–Consolidated: 2015–$27,607.8; 2014–
$29,264.7; 2013–$30,679.8; U.S. based: 2015–$11,940.4; 2014–
$11,883.1; 2013–$11,632.2.