McDonalds 2015 Annual Report Download - page 22
Download and view the complete annual report
Please find page 22 of the 2015 McDonalds annual report below. You can navigate through the pages in the report by either clicking on the pages listed below, or by using the keyword search tool below to find specific information within the annual report.-
 1
1 -
2
-
3
-
4
-
5
-
6
-
7
-
8
-
9
-
10
-
11
-
 12
12 -
 13
13 -
 14
14 -
 15
15 -
 16
16 -
 17
17 -
 18
18 -
 19
19 -
 20
20 -
 21
21 -
 22
22 -
 23
23 -
 24
24 -
 25
25 -
 26
26 -
 27
27 -
 28
28 -
 29
29 -
 30
30 -
 31
31 -
 32
32 -
33
-
34
-
35
-
36
-
37
-
38
-
39
-
40
-
41
-
42
-
43
-
44
-
45
-
46
-
47
-
48
-
49
-
50
-
51
-
52
-
53
-
54
-
55
-
56
-
57
-
58
-
59
-
60
 |
 |

20 McDonald's Corporation 2015 Annual Report
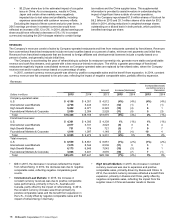
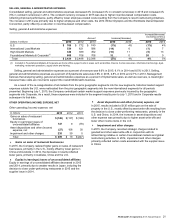
FRANCHISED MARGINS
Franchised margin dollars represent revenues from franchised restaurants less the Company’s occupancy costs (rent and depreciation)
associated with those sites. Franchised margin dollars represented about 70% of the combined restaurant margins in 2015, 2014 and 2013.
In 2015, franchised margin dollars decreased $297 million or 4% (increased 4% in constant currencies). The constant currency
increase was due to positive comparable sales performance, expansion and refranchising. In 2014, franchised margin dollars decreased
$32 million or 0% (increased 1% in constant currencies), reflecting a benefit from expansion and refranchising, offset by negative
comparable sales performance.
In connection with the Company's long-term financial targets, the Company plans to refranchise about 4,000 restaurants for the four-
year period ending 2018. While this refranchising activity may have a dilutive effect on the franchised margin percent, it typically results in
higher franchised margin dollars.
Franchised margins
Amount
% of
Revenue Amount
% of
Revenue Amount
% of
Revenue
Increase/
(decrease)
Increase/(decrease)
excluding currency
translation
Dollars in millions 2015 2014 2013 2015 2014 2015 2014
U.S. $3,606 82.7% $3,572 83.1% $3,626 83.6% 1% (1%) 1% (1%)
International Lead Markets 2,254 80.0 2,486 80.1 2,430 80.4 (9) 264
High Growth Markets 520 71.1 555 71.7 531 73.6 (6) 474
Foundational Markets & Corporate 898 88.3 962 87.7 1,020 88.9 (7) (6) 11 3
Total $7,278 81.5% $7,575 81.7% $7,607 82.4% (4%) 0% 4% 1%
• US: In 2015, the decrease in the franchised margin percent
was due to higher occupancy costs. In 2014, the decrease
was primarily due to negative comparable sales and higher
occupancy costs.
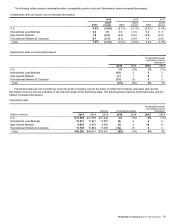
• International Lead Markets: In 2015, the franchised margin
percent reflected the benefit from positive comparable sales
performance and the negative impact from higher lease
expense and refranchising. In 2014, the decrease was due to
weaker results in Germany and the negative impact from
refranchising, primarily in Germany and Australia, partly offset
by positive results in the U.K.
• High Growth Markets: In 2015, the decrease in the
franchised margin percent was primarily due to the impact
from refranchising. In 2014, the decrease was primarily due to
negative comparable sales across the segment.
The franchised margin percent in Foundational Markets &
Corporate is higher relative to the other segments due to a larger
proportion of developmental licensed and/or affiliated restaurants
where the Company receives royalty income with no
corresponding occupancy costs.
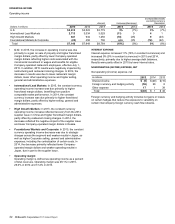
COMPANY-OPERATED MARGINS
Company-operated margin dollars represent sales by Company-operated restaurants less the operating costs of these restaurants. In 2015,
Company-operated margin dollars decreased $370 million or 13% (1% in constant currencies). In 2014, Company-operated margin dollars
decreased $415 million or 13% (11% in constant currencies), reflecting weak results across all segments.
Company-operated margins
Amount
% of
Revenue Amount
% of
Revenue Amount
% of
Revenue
Increase/
(decrease)
Increase/(decrease)
excluding currency
translation
Dollars in millions 2015 2014 2013 2015 2014 2015 2014
U.S. $ 632 15.1% $ 756 17.4% $ 830 18.4% (16%) (9%) (16%) (9%)
International Lead Markets 961 20.0 1,080 19.8 1,079 19.6 (11) 021
High Growth Markets 659 12.1 780 12.9 1,019 16.1 (16) (23) 3(19)
Foundational Markets & Corporate 259 12.7 265 11.5 368 14.6 (2) (28) 15 (25)
Total $2,511 15.2% $2,881 15.9% $3,296 17.5% (13%) (13%) (1%) (11%)
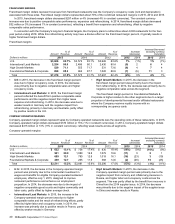
• U.S.: In 2015, the decrease in the Company-operated margin
percent was primarily due to the incremental investment in
wages and benefits for eligible Company-operated restaurant
employees, effective July 1, 2015, designed to improve
restaurant performance and enhance our employment
proposition. In 2014, the decrease was due to the impact of
negative comparable guest counts and higher commodity and
labor costs, partly offset by higher average check.
• International Lead Markets: In 2015, the increase in the
Company-operated margin percent was due to higher
comparable sales and the result of refranchising efforts, partly
offset by higher labor and occupancy costs. In 2014, the
increase was primarily due to positive results in France, partly
offset by weaker results in Germany.
• High Growth Markets: In 2015, the decrease in the
Company-operated margin percent was primarily due to the
negative impact from currency and inflationary pressures in
Russia, and higher labor and occupancy costs across the
segment. This was partly offset by the benefit from recovery in
China from the 2014 supplier issue. In 2014, the decrease
was primarily due to the negative impact of the supplier issue
in China and weaker results in Russia.