McDonalds 2015 Annual Report Download - page 23
Download and view the complete annual report
Please find page 23 of the 2015 McDonalds annual report below. You can navigate through the pages in the report by either clicking on the pages listed below, or by using the keyword search tool below to find specific information within the annual report.-
 1
1 -
2
-
3
-
4
-
5
-
6
-
7
-
8
-
9
-
10
-
11
-
12
-
 13
13 -
 14
14 -
 15
15 -
 16
16 -
 17
17 -
 18
18 -
 19
19 -
 20
20 -
 21
21 -
 22
22 -
 23
23 -
 24
24 -
 25
25 -
 26
26 -
 27
27 -
 28
28 -
 29
29 -
 30
30 -
 31
31 -
 32
32 -
 33
33 -
34
-
35
-
36
-
37
-
38
-
39
-
40
-
41
-
42
-
43
-
44
-
45
-
46
-
47
-
48
-
49
-
50
-
51
-
52
-
53
-
54
-
55
-
56
-
57
-
58
-
59
-
60
 |
 |

McDonald's Corporation 2015 Annual Report 21
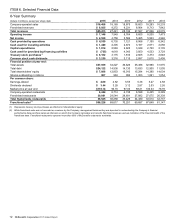
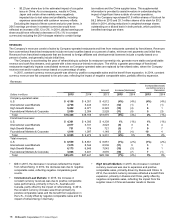
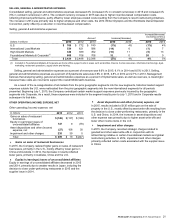
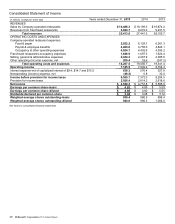
SELLING, GENERAL & ADMINISTRATIVE EXPENSES
Consolidated selling, general and administrative expenses decreased 2% (increased 4% in constant currencies) in 2015 and increased 4%
(5% in constant currencies) in 2014. The constant currency increase in 2015 was due to higher incentive-based compensation costs
reflecting improved performance, partly offset by lower employee-related costs resulting from the Company's recent restructuring initiatives.
The increase in 2014 was primarily due to higher employee and other costs, the 2014 Winter Olympics and the Worldwide Owner/Operator
Convention, partly offset by a reduction in incentive-based compensation.
Selling, general & administrative expenses
Amount Increase/(decrease)
Increase/(decrease)
excluding currency
translation
Dollars in millions 2015 2014 2013 2015 2014 2015 2014
U.S. $ 766 $ 772 $ 740 (1%) 4% (1%) 4%
International Lead Markets 534 621 586 (14) 6(1) 7
High Growth Markets 326 389 352 (16) 11 (5) 13
Foundational Markets & Corporate(1) 808 706 708 15 020 0
Total $ 2,434 $ 2,488 $ 2,386 (2%) 4% 4% 5%
(1) Included in Foundational Markets & Corporate are home office support costs in areas such as facilities, finance, human resources, information technology, legal,
marketing, restaurant operations, supply chain and training.
Selling, general and administrative expenses as a percent of revenues was 9.6% in 2015, 9.1% in 2014 and 8.5% in 2013. Selling,
general and administrative expenses as a percent of Systemwide sales was 2.9% in 2015, 2.8% in 2014 and 2.7% in 2013. Management
believes that analyzing selling, general and administrative expenses as a percent of Systemwide sales, as well as revenues, is meaningful
because these costs are incurred to support the overall McDonald's business.
As a result of the re-categorization of all markets from the prior geographic segments into the new segments, historical market support
expenses outside the U.S. were reallocated from the prior geographic segments into the new international segments for all periods
presented. Beginning July 1, 2015, the Company centralized certain market support expenses previously incurred by the geographic
segments into Corporate. As a result, these expenses were included in the segment results prior to July 1, 2015 and in Corporate results
subsequent to that date.
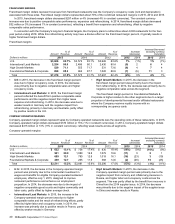
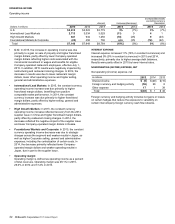
OTHER OPERATING (INCOME) EXPENSE, NET
Other operating (income) expense, net
In millions 2015 2014 2013
Gains on sales of restaurant
businesses $(146) $(137) $(199)
Equity in (earnings) losses of
unconsolidated affiliates 147 9(78)
Asset dispositions and other (income)
expense, net (27) 108 30
Impairment and other charges 235 39 0
Total $209 $ 19 $(247)
Gains on sales of restaurant businesses
In 2015, the Company realized higher gains on sales of restaurant
businesses, primarily in the U.S., mostly offset by lower gains in
China and Australia. In 2014, the decrease in results reflected
lower gains, primarily in Australia, China and the U.S.
Equity in (earnings) losses of unconsolidated affiliates
Equity in earnings of unconsolidated affiliates decreased in 2015
and 2014, primarily due to weaker results in Japan, including the
decision to close under-performing restaurants in 2015 and the
supplier issue in 2014.
Asset dispositions and other (income) expense, net
In 2015, results included a $135 million gain on the sale of
property in the U.S., mostly offset by asset write-offs resulting from
the decision to close under-performing restaurants, primarily in the
U.S. and China. In 2014, the increase in asset dispositions and
other expense was primarily due to higher asset write-offs and
lower other income items in the U.S.
Impairment and other charges
In 2015, the Company recorded strategic charges related to
goodwill and other asset write-offs in conjunction with its
refranchising initiative in certain Foundational markets and global
restructuring activities. In 2014, impairment and other charges
primarily reflected certain costs associated with the supplier issue
in China.