McDonalds 2015 Annual Report Download - page 21
Download and view the complete annual report
Please find page 21 of the 2015 McDonalds annual report below. You can navigate through the pages in the report by either clicking on the pages listed below, or by using the keyword search tool below to find specific information within the annual report.-
 1
1 -
2
-
3
-
4
-
5
-
6
-
7
-
8
-
9
-
10
-
 11
11 -
 12
12 -
 13
13 -
 14
14 -
 15
15 -
 16
16 -
 17
17 -
 18
18 -
 19
19 -
 20
20 -
 21
21 -
 22
22 -
 23
23 -
 24
24 -
 25
25 -
 26
26 -
 27
27 -
 28
28 -
 29
29 -
 30
30 -
 31
31 -
32
-
33
-
34
-
35
-
36
-
37
-
38
-
39
-
40
-
41
-
42
-
43
-
44
-
45
-
46
-
47
-
48
-
49
-
50
-
51
-
52
-
53
-
54
-
55
-
56
-
57
-
58
-
59
-
60
 |
 |

McDonald's Corporation 2015 Annual Report 19
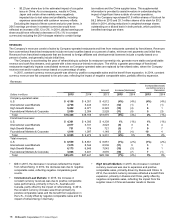
The following tables present comparable sales, comparable guest counts and Systemwide sales increases/(decreases):
Comparable sales and guest count increases/(decreases)
2015 2014 2013
Sales Guest
Counts Sales Guest
Counts Sales Guest
Counts
U.S. 0.5% (3.0%) (2.1%) (4.1%) (0.2%) (1.6%)
International Lead Markets 3.4 1.0 0.8 (1.2) 0.2 (1.1)
High Growth Markets 1.8 (2.2) (2.8) (2.9) (0.6) (2.2)
Foundational Markets & Corporate 0.7 (3.7) (0.1) (4.8) 1.5 (3.0)
Total 1.5% (2.3%) (1.0%) (3.6%) 0.2% (1.9%)
Systemwide sales increases/(decreases)
Increase/(decrease)
excluding currency
translation
2015 2014 2015 2014
U.S. 1% (1%) 1% (1%)
International Lead Markets (10) 253
High Growth Markets (7) 184
Foundational Markets & Corporate (13) (7) 33
Total (6%) (2%) 3% 1%
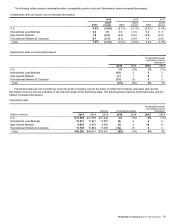
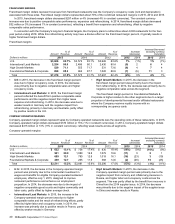
Franchised sales are not recorded as revenues by the Company, but are the basis on which the Company calculates and records
franchised revenues and are indicative of the financial health of the franchisee base. The following table presents franchised sales and the
related increases/(decreases):
Franchised sales
Amount Increase/(decrease)
Increase/(decrease)
excluding currency
translation
Dollars in millions 2015 2014 2013 2015 2014 2015 2014
U.S. $31,639 $31,096 $31,344 2% (1%) 2% (1%)
International Lead Markets 16,313 17,921 17,507 (9) 264
High Growth Markets 4,525 4,678 4,305 (3) 910 8
Foundational Markets & Corporate 13,749 15,922 17,095 (14) (7) 34
Total $66,226 $69,617 $70,251 (5%) (1%) 4% 2%