McDonalds 2015 Annual Report Download - page 19
Download and view the complete annual report
Please find page 19 of the 2015 McDonalds annual report below. You can navigate through the pages in the report by either clicking on the pages listed below, or by using the keyword search tool below to find specific information within the annual report.-
 1
1 -
2
-
3
-
4
-
5
-
6
-
7
-
8
-
 9
9 -
 10
10 -
 11
11 -
 12
12 -
 13
13 -
 14
14 -
 15
15 -
 16
16 -
 17
17 -
 18
18 -
 19
19 -
 20
20 -
 21
21 -
 22
22 -
 23
23 -
 24
24 -
 25
25 -
 26
26 -
 27
27 -
 28
28 -
 29
29 -
30
-
31
-
32
-
33
-
34
-
35
-
36
-
37
-
38
-
39
-
40
-
41
-
42
-
43
-
44
-
45
-
46
-
47
-
48
-
49
-
50
-
51
-
52
-
53
-
54
-
55
-
56
-
57
-
58
-
59
-
60
 |
 |

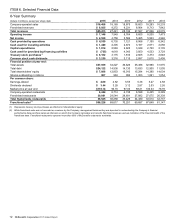
McDonald's Corporation 2015 Annual Report 17
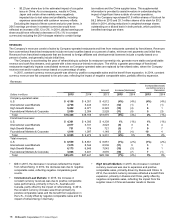
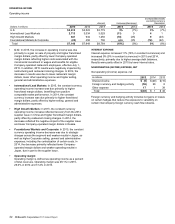
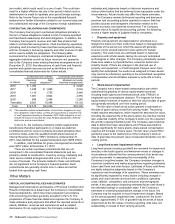
Consolidated Operating Results
Operating results
2015 2014 2013
Dollars and shares in millions, except per share data Amount
Increase/
(decrease) Amount
Increase/
(decrease) Amount
Revenues
Sales by Company-operated restaurants $16,488 (9%) $18,169 (4%) $18,875
Revenues from franchised restaurants 8,925 (4) 9,272 0 9,231
Total revenues 25,413 (7) 27,441 (2) 28,106
Operating costs and expenses
Company-operated restaurant expenses 13,977 (9) 15,288 (2) 15,579
Franchised restaurants-occupancy expenses 1,647 (3) 1,697 4 1,624
Selling, general & administrative expenses 2,434 (2) 2,488 4 2,386
Other operating (income) expense, net 209 n/m 19 n/m (247)
Total operating costs and expenses 18,267 (6) 19,492 1 19,342
Operating income 7,146 (10) 7,949 (9) 8,764
Interest expense 638 11 576 9 528
Nonoperating (income) expense, net (48) n/m 1n/m 32
Income before provision for income taxes 6,556 (11) 7,372 (10) 8,204
Provision for income taxes 2,027 (22) 2,614 0 2,618
Net income $ 4,529 (5%) $ 4,758 (15%) $ 5,586
Earnings per common share—diluted $ 4.80 0% $ 4.82 (13%) $ 5.55
Weighted-average common shares outstanding—
diluted 944.6 (4%) 986.3 (2%) 1,006.0
n/m Not meaningful
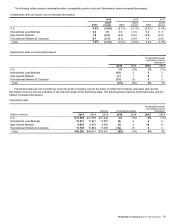
IMPACT OF FOREIGN CURRENCY TRANSLATION ON REPORTED RESULTS
While changes in foreign currency exchange rates affect reported results, McDonald’s mitigates exposures, where practical, by purchasing
goods and services in local currencies, financing in local currencies and hedging certain foreign-denominated cash flows.
Foreign currency translation had a negative impact on consolidated operating results in each of the last three years. In 2015, results
were negatively impacted by the strengthening of the U.S. Dollar against the Euro, Australian Dollar, Russian Ruble and most other
currencies. In 2014, results were negatively impacted by the weaker Russian Ruble, Australian Dollar and certain other currencies, partly
offset by the stronger British Pound. In 2013, results were negatively impacted by the weaker Australian Dollar, Japanese Yen and many
other foreign currencies, partly offset by the stronger Euro.
Impact of foreign currency translation on reported results
Reported amount Currency translation
benefit/(cost)
In millions, except per share data 2015 2014 2013 2015 2014 2013
Revenues $25,413 $ 27,441 $ 28,106 $(2,829) $ (570) $ (29)
Company-operated margins 2,511 2,881 3,296 (331) (60) (7)
Franchised margins 7,278 7,575 7,607 (626) (119) (43)
Selling, general & administrative expenses 2,434 2,488 2,386 158 21 (5)
Operating income 7,146 7,949 8,764 (771) (152) (66)
Net income 4,529 4,758 5,586 (473) (114) (52)
Earnings per common share—diluted 4.80 4.82 5.55 (0.50) (0.12) (0.05)
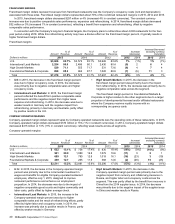
NET INCOME AND DILUTED EARNINGS PER COMMON SHARE
In 2015, net income decreased 5% (increased 5% in constant
currencies) to $4.5 billion and diluted earnings per common share
was flat (increased 10% in constant currencies) at $4.80. Foreign
currency translation had a negative impact of $0.50 on diluted
earnings per share.
In 2014, net income decreased 15% (13% in constant
currencies) to $4.8 billion and diluted earnings per common share
decreased 13% (11% in constant currencies) to $4.82. Foreign
currency translation had a negative impact of $0.12 on diluted
earnings per share.
Results in 2015 benefited from higher franchised margins and
a gain on sale of property in the U.S., partly offset by strategic
charges, primarily related to goodwill impairment and other asset
write-offs in conjunction with the Company's refranchising
initiatives, restructuring and incremental restaurant closings. The
strategic charges and gain on sale of property in the U.S. had a
negative net impact on diluted earnings per share of $0.18 in
2015.
Results in 2014 were negatively impacted by the following
items that had a negative impact of $0.54 on diluted earnings per
share:
• $0.31 per share due to an increase in tax reserves for
2003-2010 resulting from an unfavorable lower tax court
ruling in a foreign tax jurisdiction, as well as an increase
in tax reserves related to audit progression in other
foreign tax jurisdictions.