McDonalds 2015 Annual Report Download - page 25
Download and view the complete annual report
Please find page 25 of the 2015 McDonalds annual report below. You can navigate through the pages in the report by either clicking on the pages listed below, or by using the keyword search tool below to find specific information within the annual report.-
 1
1 -
2
-
3
-
4
-
5
-
6
-
7
-
8
-
9
-
10
-
11
-
12
-
13
-
14
-
 15
15 -
 16
16 -
 17
17 -
 18
18 -
 19
19 -
 20
20 -
 21
21 -
 22
22 -
 23
23 -
 24
24 -
 25
25 -
 26
26 -
 27
27 -
 28
28 -
 29
29 -
 30
30 -
 31
31 -
 32
32 -
 33
33 -
 34
34 -
 35
35 -
36
-
37
-
38
-
39
-
40
-
41
-
42
-
43
-
44
-
45
-
46
-
47
-
48
-
49
-
50
-
51
-
52
-
53
-
54
-
55
-
56
-
57
-
58
-
59
-
60
 |
 |

McDonald's Corporation 2015 Annual Report 23
PROVISION FOR INCOME TAXES
In 2015, 2014 and 2013, the reported effective income tax rates
were 30.9%, 35.5% and 31.9%, respectively.
In 2014, the higher effective income tax rate was primarily due
to a change in tax reserves for 2003-2010 resulting from an
unfavorable lower tax court ruling in a foreign tax jurisdiction, as
well as the impact of changes in tax reserves related to audit
progression in multiple foreign tax jurisdictions. These items had a
negative impact of 4.1% on the effective tax rate.
In 2013, the effective income tax rate included a tax benefit of
nearly $50 million, reflecting the retroactive impact of certain tax
benefits as a result of the American Taxpayer Relief Act of 2012.
Consolidated net deferred tax liabilities included tax assets,
net of valuation allowance, of $1.8 billion in 2015 and $1.6 billion
in 2014. Substantially all of the net tax assets are expected to be
realized in the U.S. and other profitable markets.
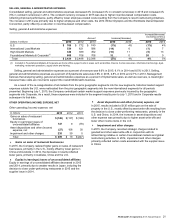
RECENTLY ISSUED ACCOUNTING STANDARDS
Revenue Recognition
In May 2014, the Financial Accounting Standards Board ("FASB")
issued guidance codified in Accounting Standards Codification
("ASC") 606, "Revenue Recognition - Revenue from Contracts
with Customers," which amends the guidance in ASC 605,
"Revenue Recognition." In July 2015, the FASB made a decision
to defer by one year the effective date of its new standard to
January 1, 2018, although early adoption is permitted as of
January 1, 2017.
The new standard allows for either a full retrospective or
modified retrospective transition approach. The Company does not
believe that the standard will impact its recognition of revenue
from company-operated restaurants or its recognition of royalties
from restaurants operated by franchisees or licensed to affiliates
and developmental licensees, which are based on a percent of
sales. The Company is continuing to evaluate the impact the
adoption of this standard will have on the recognition of other less
significant revenue transactions, such as initial fees from
franchisees for new restaurant openings or new franchise terms.
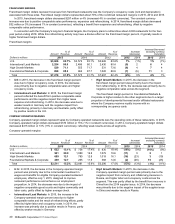
Cash Flows
The Company generates significant cash from its operations and
has substantial credit availability and capacity to fund operating
and discretionary spending such as capital expenditures, debt
repayments, dividends and share repurchases.
Cash provided by operations totaled $6.5 billion and
exceeded capital expenditures by $4.7 billion in 2015, while cash
provided by operations totaled $6.7 billion and exceeded capital
expenditures by $4.1 billion in 2014. In 2015, cash provided by
operations decreased $191 million or 3% compared with 2014,
primarily due to lower operating results, including the impact from
weaker foreign currencies, and other operating activity. This was
partly offset by changes in working capital. In 2014, cash provided
by operations decreased $390 million or 5% compared with 2013
primarily due to lower operating results, partly offset by lower
income tax payments.
Cash used for investing activities totaled $1.4 billion in 2015,
a decrease of $885 million compared with 2014. The decrease
primarily reflected lower capital expenditures. Cash used for
investing activities totaled $2.3 billion in 2014, a decrease of $369
million compared with 2013. The decrease primarily reflected
lower capital expenditures, a decrease in other investing activities
related to short-term time deposits and higher proceeds from sales
of restaurant businesses.
Cash provided by financing activities totaled $735 million in
2015, an increase of $5.4 billion compared with 2014, primarily
due to an increase in net borrowings, partly offset by higher
treasury stock purchases. Cash used for financing activities
totaled $4.6 billion in 2014, an increase of $575 million compared
with 2013, primarily due to higher treasury stock purchases, partly
offset by an increase in net borrowings.
The Company’s cash and equivalents balance was $7.7
billion and $2.1 billion at year end 2015 and 2014, respectively.
The increase in 2015 was due to higher net borrowings to be used
primarily for share repurchases in 2016. In addition to cash and
equivalents on hand and cash provided by operations, the
Company can meet short-term funding needs through its
continued access to commercial paper borrowings and line of
credit agreements.
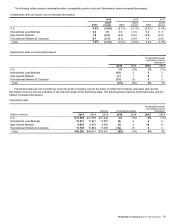
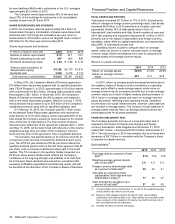
RESTAURANT DEVELOPMENT AND CAPITAL EXPENDITURES
In 2015, the Company opened 989 restaurants and closed 722
restaurants. In 2014, the Company opened 1,316 restaurants and
closed 487 restaurants. The increase in restaurant closings in
2015 reflected a strategic review that resulted in additional
closures of under-performing restaurants. The Company closes
restaurants for a variety of reasons, such as existing sales and
profit performance or loss of real estate tenure.
Systemwide restaurants at year end
2015 2014 2013
U.S. 14,259 14,350 14,278
International Lead Markets 6,802 6,717 6,604
High Growth Markets 5,266 5,031 4,639
Foundational Markets &
Corporate 10,198 10,160 9,908
Total 36,525 36,258 35,429
Approximately 82% of the restaurants at year-end 2015 were
franchised, including 90% in the U.S., 82% in International Lead
markets, 46% in High Growth markets and 90% in Foundational
markets.
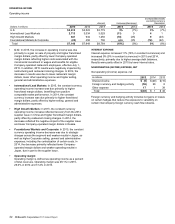
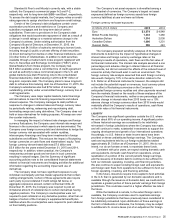
Capital expenditures decreased $769 million or 30% in 2015,
primarily due to fewer new restaurant openings and lower
reinvestment at existing restaurants. Capital expenditures
decreased $242 million or 9% in 2014, primarily due to lower
reinvestment in existing restaurants. In both years, the lower
reinvestment primarily reflected fewer reimages.
Capital expenditures invested in the U.S., International Lead
markets and High Growth markets represented about 90% of the
total in 2015, 2014 and 2013.
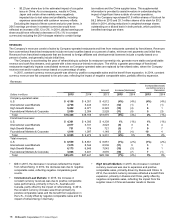
Capital expenditures
In millions 2015 2014 2013
New restaurants $892$ 1,435 $ 1,473
Existing restaurants 842 1,044 1,244
Other(1) 80 104 108
Total capital expenditures $1,814 $ 2,583 $ 2,825
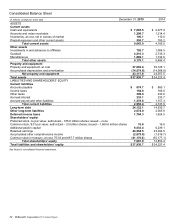
Total assets $37,939 $34,227 $36,626
(1) Primarily corporate equipment and other office-related expenditures.
New restaurant investments in all years were concentrated in
markets with strong returns or opportunities for long-term growth.
Average development costs vary widely by market depending on
the types of restaurants built and the real estate and construction
costs within each market. These costs, which include land,
buildings and equipment, are managed through the use of
optimally-sized restaurants, construction and design efficiencies,
and leveraging best practices. Although the Company is not
responsible for all costs for every restaurant opened, total
development costs (consisting of land, buildings and equipment)